![]() See this visualization first on the Voronoi app.
See this visualization first on the Voronoi app.
Visualizing Chinese EV Market Share Overseas
This was originally posted on our Voronoi app. Download the app for free on iOS or Android and discover incredible data-driven charts from a variety of trusted sources.
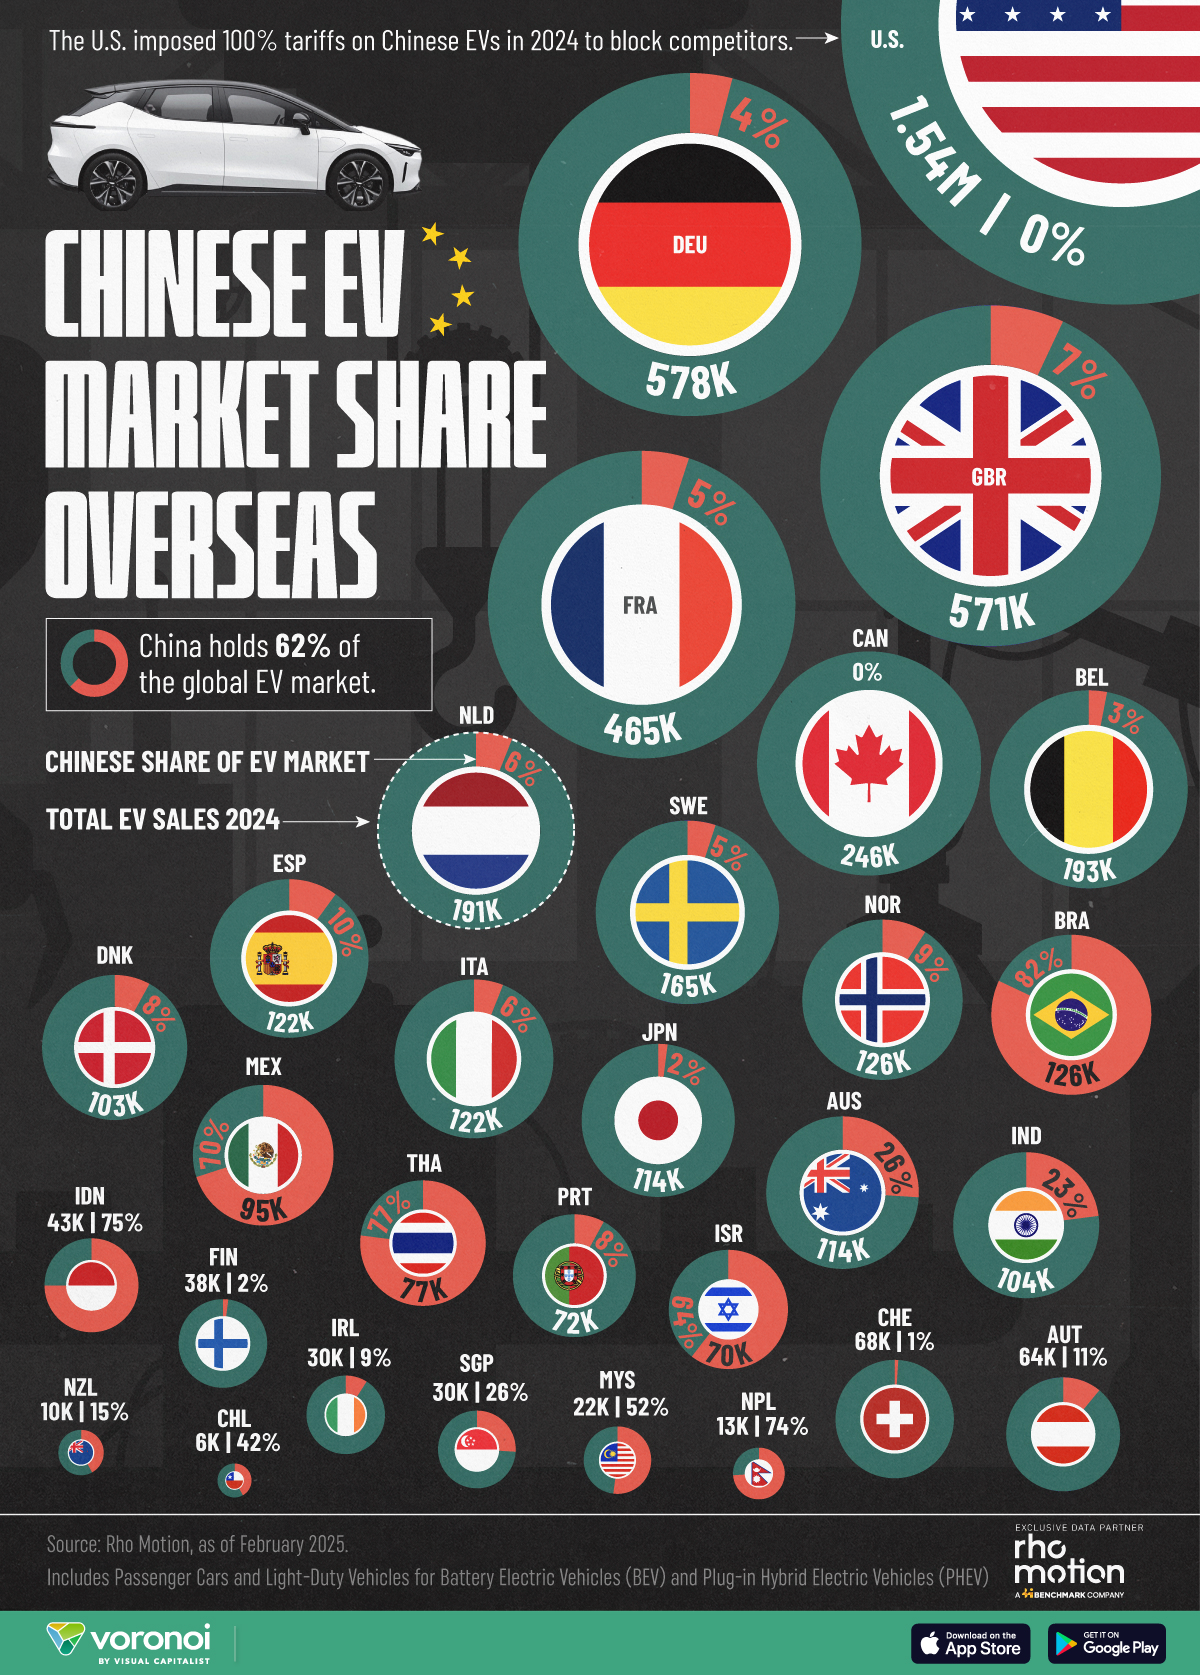
China is the undisputed global powerhouse of the EV industry, leading in both domestic sales and overall production. Chinese brands were responsible for 62% of EV global sales in 2024.
This graphic shows the presence of Chinese electric vehicles in other countries, considering total EV sales and market share. This data comes exclusively from Rho Motion’s EV Sales Quarterly Outlook, as of 2024.
Affordable EVs
As the global EV market has expanded, in 2024, over 17 million units were sold. Chinese manufacturers have aggressively pursued international opportunities, offering affordable vehicles that often undercut local competitors.
However, market access has varied significantly across regions. The U.S. and Canada are the only markets where Chinese-made EVs have no presence. The U.S. has taken a firm stance against Chinese EVs, imposing a 100% tariff in 2024, and more recently enacting laws banning Chinese technology in EVs on U.S. roads. Given its deep economic ties with the U.S., Canada followed suit with identical tariffs.
| Country | Total EV Sales | Chinese Market Share |
|---|---|---|
 U.S. U.S. |
1,540,354 | 0% |
 Germany Germany |
577,630 | 4% |
 UK UK |
571,141 | 7% |
 France France |
464,589 | 5% |
 Canada Canada |
246,424 | 0% |
 Belgium Belgium |
192,560 | 3% |
 Netherlands Netherlands |
190,784 | 6% |
 Sweden Sweden |
165,256 | 5% |
 Norway Norway |
126,088 | 9% |
 Brazil Brazil |
125,624 | 82% |
 Spain Spain |
122,375 | 10% |
 Italy Italy |
121,889 | 6% |
 Japan Japan |
114,129 | 2% |
 Australia Australia |
113,511 | 26% |
 India India |
104,426 | 23% |
 Denmark Denmark |
103,202 | 8% |
 Mexico Mexico |
95,282 | 70% |
 Thailand Thailand |
77,250 | 77% |
 Portugal Portugal |
72,070 | 8% |
 Israel Israel |
69,595 | 64% |
 Switzerland Switzerland |
68,407 | 1% |
 Austria Austria |
63,717 | 11% |
 Indonesia Indonesia |
43,202 | 75% |
 Finland Finland |
37,881 | 2% |
 Ireland Ireland |
30,105 | 9% |
 Singapore Singapore |
29,521 | 26% |
 Malaysia Malaysia |
21,798 | 52% |
 Nepal Nepal |
12,705 | 74% |
 New Zealand New Zealand |
10,027 | 15% |
 Chile Chile |
5,604 | 42% |
Europe, by contrast, has been more open to Chinese EVs but remains cautious about protecting its domestic automotive industry. In 2024, following an anti-subsidy investigation, the EU introduced variable BEV import tariffs on specific Chinese automakers of up to an additional 35.3%.
Meanwhile, in countries without a strong domestic auto industry, Chinese EVs have rapidly gained market share. This is especially evident in neighboring Asian countries and in South and Central America, where Chinese manufacturers are expanding aggressively by beginning to build production capacity and capitalizing on the demand for affordable electric vehicles.
Learn More on the Voronoi App 
If you enjoyed this post, be sure to check out this graphic, which forecasts the number of mines that must be developed to meet the expected demand for energy transition raw materials and chemicals by 2030.
The post Visualizing Chinese EV Market Share Overseas appeared first on Visual Capitalist.