Ranked: Top 15 Countries by Carbon Emissions in 2023
This was originally posted on our Voronoi app. Download the app for free on iOS or Android and discover incredible data-driven charts from a variety of trusted sources.
Key Takeaways
- China ranks first by a large margin in the list of top countries by carbon emissions in 2023.
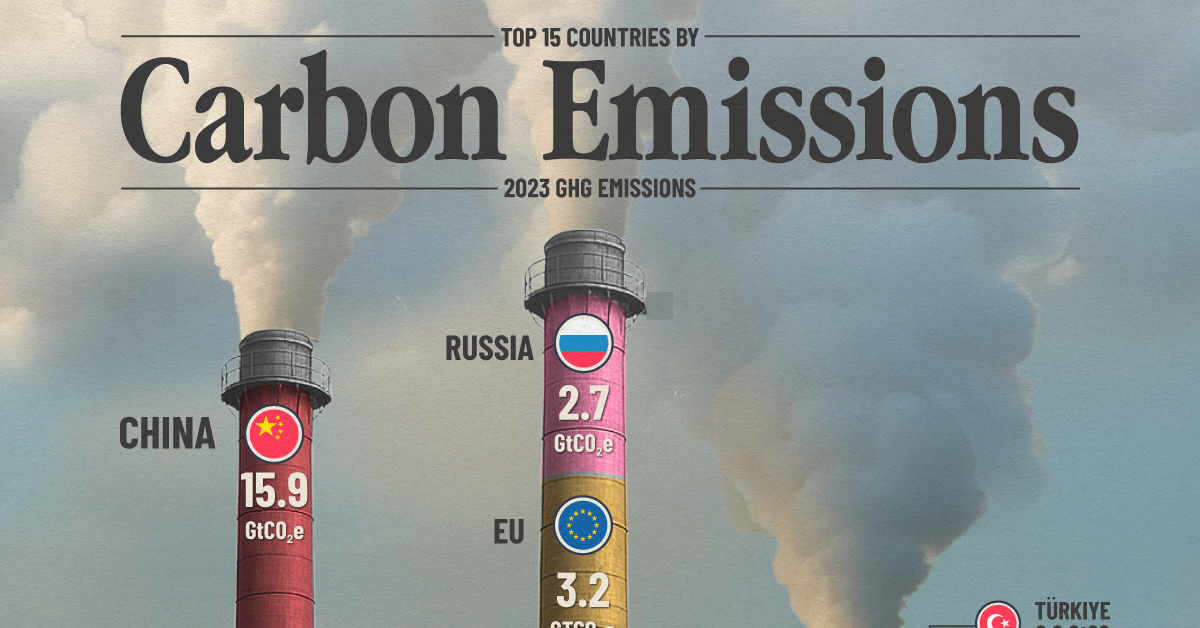
- It accounts for nearly one-third of global carbon emissions at 15.9 GtCO₂e in 2023.
- But this also reflects China’s extensive manufacturing industry that produces much of the world’s goods.
Despite countries pivoting and investing in clean energy sources in the last decade, global greenhouse gas emissions still hit new highs in 2023.
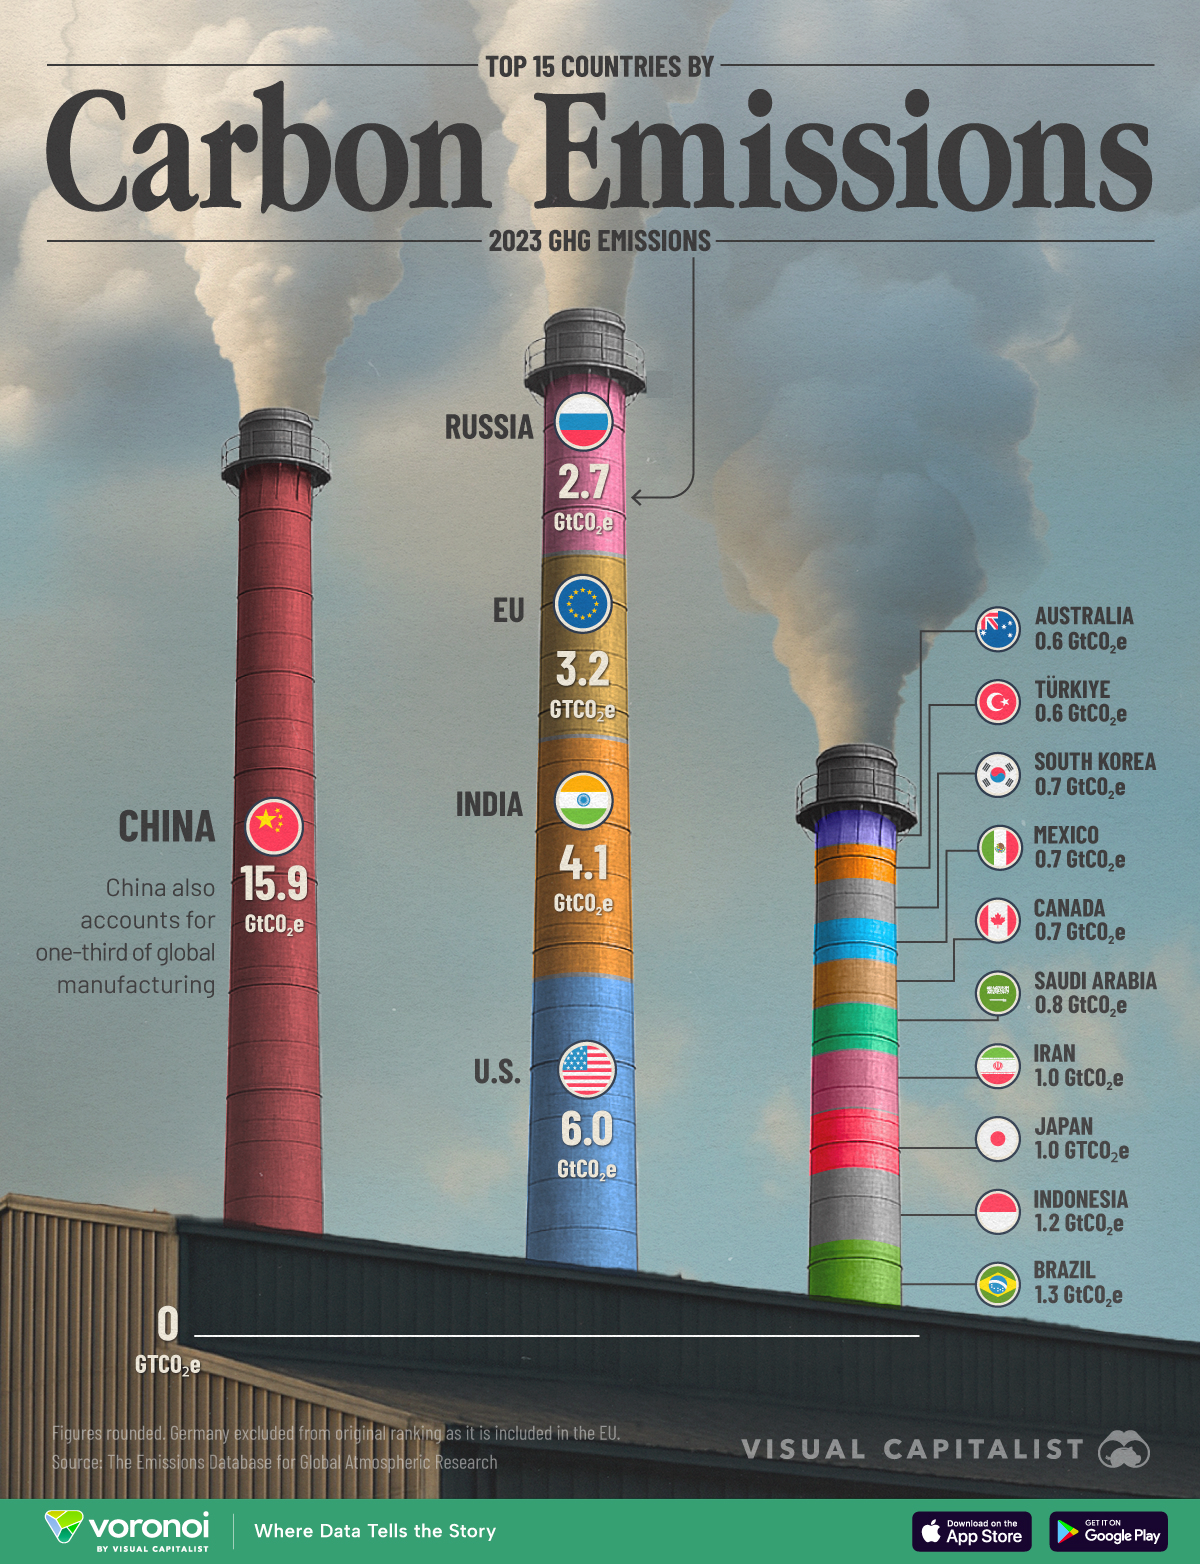
This infographic ranks the top 15 countries by carbon emissions, based on 2023 data from The Emissions Database for Global Atmospheric Research. It shows national-level greenhouse gas emissions in gigatonnes of CO₂ equivalent (GtCO₂e).
Together, these nations account for nearly 80% of global emissions.
China vs the World: Carbon Emissions Edition
China leads the world in emissions with 15.9 GtCO₂e, representing 30.1% of the global total in 2023.
| Rank | Country | GHG Emissions (2023) | Share of Global Emissions |
|---|---|---|---|
| 1 |  China China |
15.9 GtCO₂e | 30.1% |
| 2 |  U.S. U.S. |
6.0 GtCO₂e | 11.3% |
| 3 |  India India |
4.1 GtCO₂e | 7.8% |
| 4 |  EU EU |
3.2 GtCO₂e | 6.1% |
| 5 |  Russia Russia |
2.7 GtCO₂e | 5.0% |
| 6 |  Brazil Brazil |
1.3 GtCO₂e | 2.5% |
| 7 |  Indonesia Indonesia |
1.2 GtCO₂e | 2.3% |
| 8 |  Japan Japan |
1.0 GtCO₂e | 2.0% |
| 9 |  Iran Iran |
1.0 GtCO₂e | 1.9% |
| 10 |  Saudi Arabia Saudi Arabia |
0.8 GtCO₂e | 1.5% |
| 11 |  Canada Canada |
0.7 GtCO₂e | 1.4% |
| 12 |  Mexico Mexico |
0.7 GtCO₂e | 1.3% |
| 13 |  South Korea South Korea |
0.7 GtCO₂e | 1.2% |
| 14 |  Türkiye Türkiye |
0.6 GtCO₂e | 1.1% |
| 15 |  Australia Australia |
0.6 GtCO₂e | 1.1% |
| N/A | Top 15 | 41.0 GtCO₂e | 76.6% |
This reflects its role as the world’s manufacturing hub, with heavy reliance on coal and high industrial output.
In fact, China’s share of global manufacturing is also about the same (27%) showing the direct consequence of becoming the world’s production base.
The country has committed to peaking emissions before 2030, but its growth trajectory poses challenges.
This also means any progress on climate will hinge heavily both on China’s policy decisions and global consumer behavior.
U.S. and India Round Out the Top Three Carbon Emissions
The U.S. is the second-largest emitter at 6.0 GtCO₂e (11.3% of global emissions).
And this is with around 330 million people, or one-fourth of China’s population. It’s per capita emissions (15 tCO₂e) is also top-15 in the world.
In stark contrast, India ranks third with 4.1 GtCO₂e (7.8%), lower than the U.S., with four times the number of people. However, its emissions are rising as its economy and population grow, following a similar path Western industrialized countries took to prosperity.
Smaller Countries with Outsized Carbon Emissions
Nations like Saudi Arabia, Australia, and Canada appear further down the list, but have some of the highest per capita emissions globally.
Their rankings reflect both resource-driven economies and energy-intensive lifestyles.
Meanwhile, countries like Brazil and Indonesia have large emissions tied to economic development, deforestation, and land use.
Learn More on the Voronoi App 
If you enjoyed today’s post, check out Countries Above and Below Average Per Capita Emissions on Voronoi, the new app from Visual Capitalist.