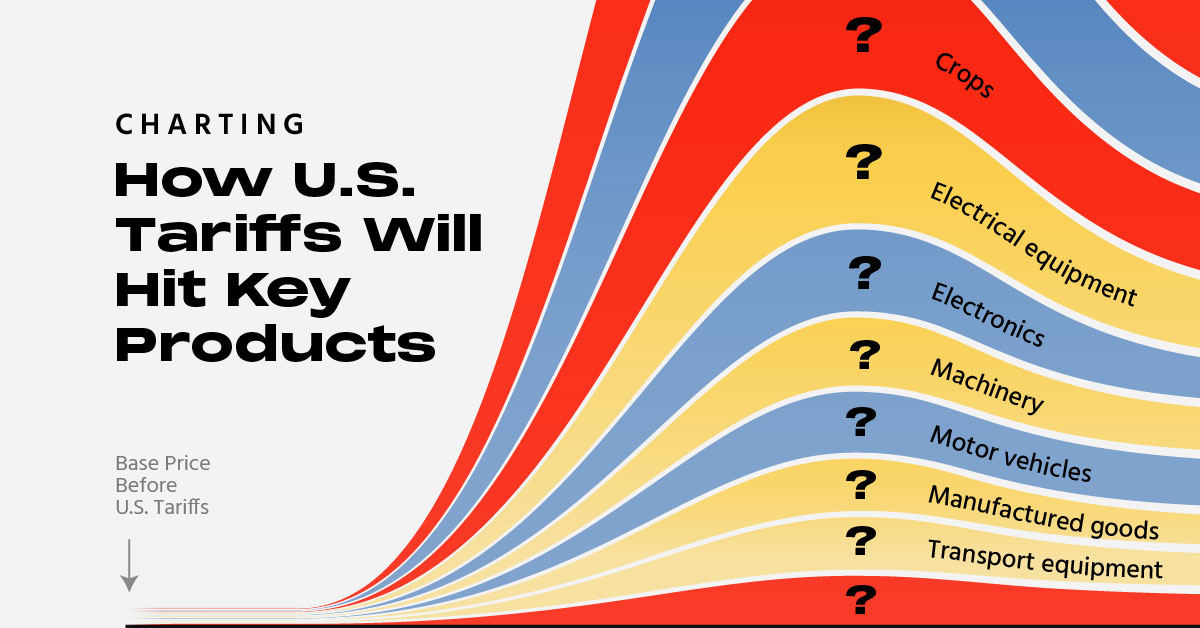


Charting How U.S. Tariffs Will Hit Key Products
U.S. tariffs have climbed to an average rate of 18.6%—the highest since 1933. But what does this mean for everyday consumers?
This visualization, developed in collaboration with the Hinrich Foundation, highlights major goods expected to face sustained price increases due to rising tariffs. Based on data from the Yale Budget Lab, it explores both short-term shocks and longer-term inflationary effects.
Tariffs & Inflation
Tariffs drive inflation by raising the cost of imported goods, pushing prices higher for both consumers and businesses that rely on them. In the short run, companies often pass these increased input costs directly onto consumers, creating immediate price spikes.
Over time, the effects compound: with less competition from foreign producers, domestic firms may raise prices as well. Retaliatory tariffs and global supply chain disruptions can further intensify these inflationary pressures.
Short-Term Price Hikes
Tariffs currently affect a wide range of countries and goods. As a result, short-term price increases are expected across numerous sectors. These spikes are most pronounced early on, as businesses have limited time or flexibility to pivot to alternative sources. In the longer term, they can adjust whether by sourcing domestically or eliminating certain inputs altogether.
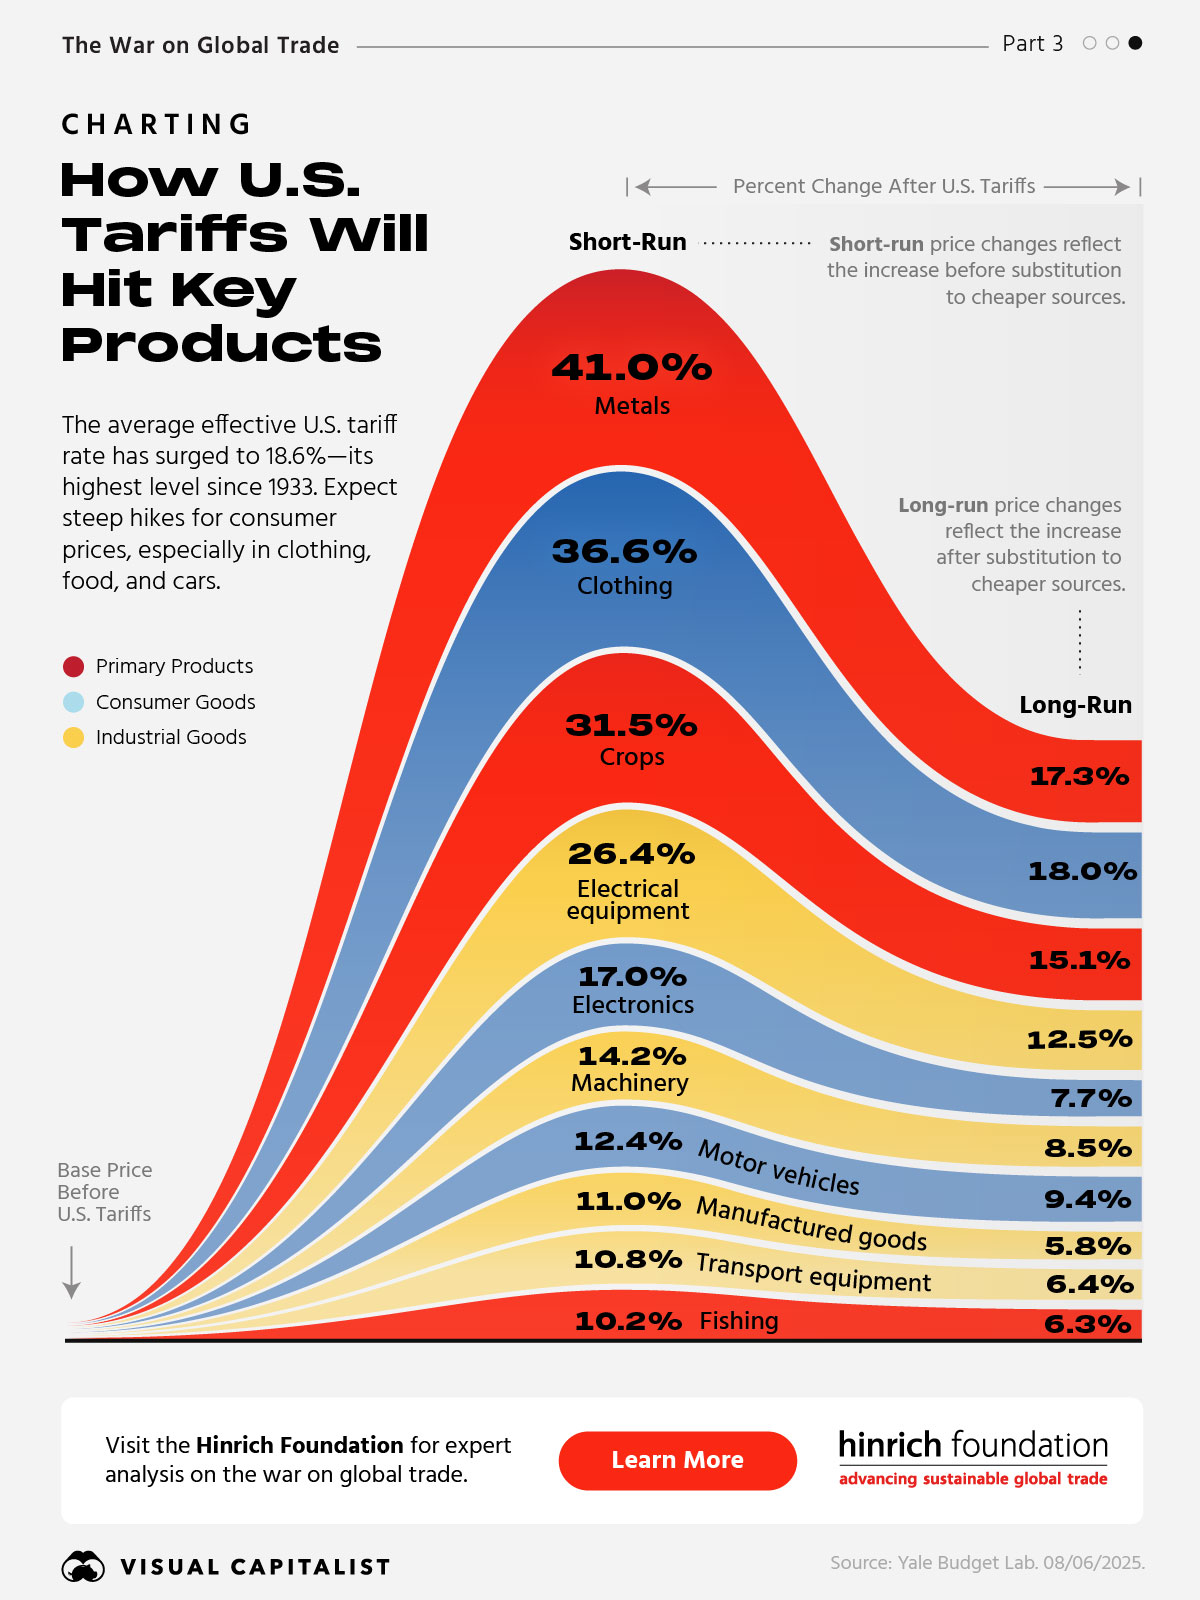
Among the hardest-hit categories are primary goods like metals, which are projected to rise by 41.0%, and crops, expected to climb by 31.5%. Consumer goods will also be significantly affected: clothing prices could jump 36.6%, electronics 17.0%, and motor vehicles 12.4%.
| Product | Short-Run (% change from baseline) | Long-Run (% change from baseline) |
|---|---|---|
| Metals | 41.0 | 17.3 |
| Clothing | 36.6 | 18.0 |
| Crops | 31.5 | 15.1 |
| Electrical equipment | 26.4 | 12.5 |
| Computers/electronics | 17.0 | 7.7 |
| Motor vehicles/parts | 12.4 | 9.4 |
| Machinery | 14.2 | 8.5 |
| Transport equipment | 10.8 | 6.4 |
| Manufactured goods | 11.0 | 5.8 |
| Fishing | 10.2 | 6.3 |
Industrial products won’t be spared either. Electrical equipment is expected to see a 26.4% increase, followed by machinery (14.2%), transport equipment (10.8%), and other manufactured goods (11.0%). With these goods playing a central role in essentials such as food, transportation, and electronics, the impact on both consumers and businesses will be tangible.
Long-Term Price Hike Persistence
Even after markets adjust and producers shift to cheaper alternatives, the price hikes are expected to persist. For every major product category, long-term increases range from approximately 6% to 20%.
Metals (17.3%) and crops (15.1%) remain among the top long-run inflation drivers. Clothing (18.0%), electrical equipment (12.5%), and electronics (7.7%) are also set to remain significantly more expensive.
Industrial categories like machinery (8.5%), transport equipment (6.4%), and manufactured goods (5.8%) will continue to see elevated prices, and motor vehicles are projected to be 9.4% costlier in the long term.
Inflation: Higher for Longer
These persistent price hikes mean that both consumers and businesses will continue to bear the financial burden of elevated costs. Over time, this could dampen consumer spending, strain profit margins, and slow broader economic growth.
Visit the Hinrich Foundation to learn more about the war on global trade.
-
 Economy2 months ago
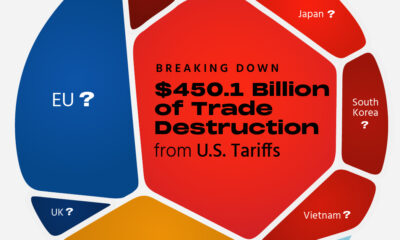
Breaking Down the $450 Billion of Trade Destruction from U.S. Tariffs
The UN has crunched the numbers projecting the ripple effects of Trump’s May 12th tariffs. Which economies are bracing for the biggest hits?
-
 Economy4 months ago
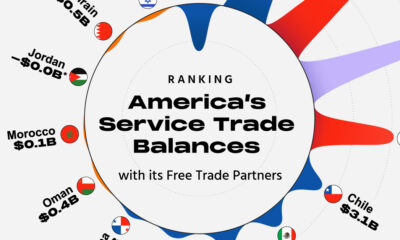
Ranked: America’s Services Trade Balances
America’s goods trade deficits have dominated headlines, but a critical part of the equation is being ignored: services trade.
-
 AI5 months ago
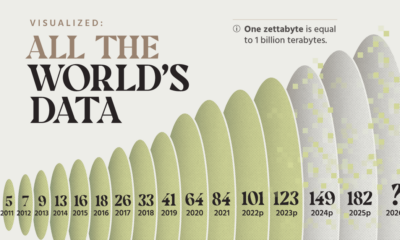
Visualized: All of the World’s Data
More data will be created, captured, and replicated in the next three years than in the rest of human history. But by how much?
-
 Economy6 months ago
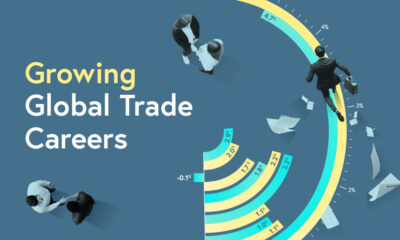
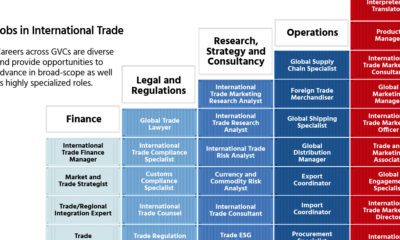
Visualized: The Growing Opportunities in Global Trade Careers
Visual Capitalist has partnered with the Hinrich Foundation to explore the landscape of global trade and find out what students and trade professionals can do to…
-
 Green6 months ago
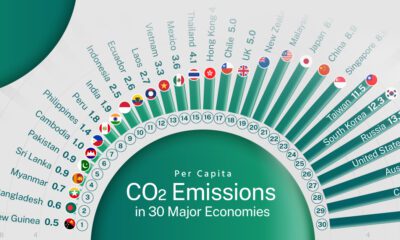
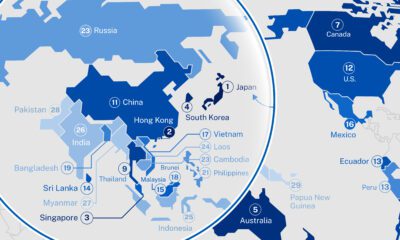
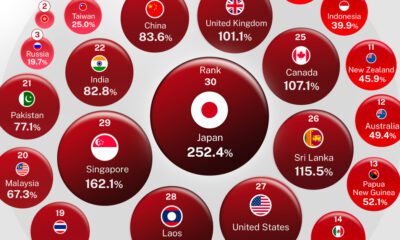
Ranked: CO₂ Emissions Per Person in 30 Economies
CO₂ emissions are reshaping the flows of international trade. Which countries have the highest and lowest CO₂ emissions per capita?
-
 Healthcare7 months ago
Mapped: Life Expectancy in Major Economies
Which countries have the highest and lowest life expectancies at birth?
-
 Markets9 months ago
Ranked: Government Debt Across Major Economies
Based on data from the IMF’s World Economic Outlook, which countries have the highest and lowest government debt ratios?
-
 Markets10 months ago
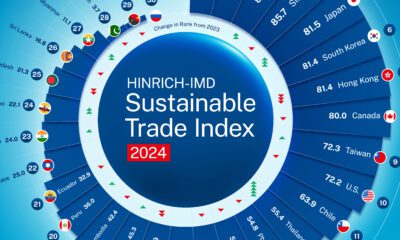
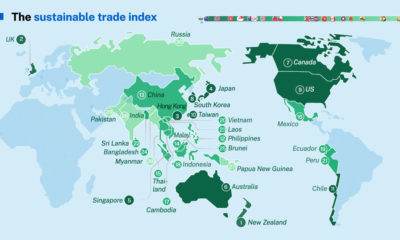
Ranked: The World’s Most Sustainable Economies in 2024
Based on the Hinrich Foundation’s 2024 Sustainable Trade Index, which economies are the most and least sustainable?
-
 Oil and Gas1 year ago
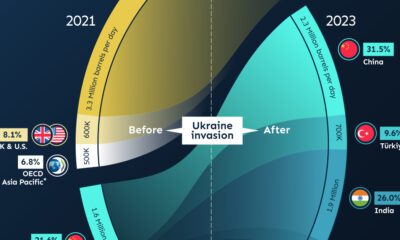
How Oil Is Adding Fuel to Geopolitical Fragmentation
Which countries and regions decreased, banned, or increased Russian oil imports following the 2022 invasion of Ukraine?
-
 Politics1 year ago
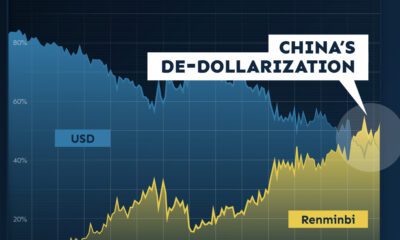
The Start of De-Dollarization: China’s Gradual Move Away from the USD
The de-dollarization of China’s trade settlements has begun. What patterns do we see in USD and RMB use within China and globally?
-
 Politics1 year ago
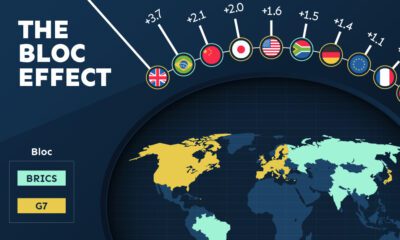
The Bloc Effect: International Trade with Geopolitical Allies on the Rise
Rising geopolitical tensions are shaping the future of international trade, but what is the effect on trading among G7 and BRICS countries?
-
 Green2 years ago
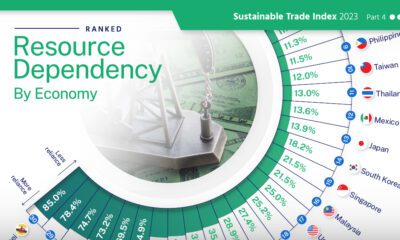
Ranked: Resource Dependency Across 30 Major Economies
High resource dependency in trade makes countries more susceptible to market fluctuations and climate change.
-
 Misc2 years ago
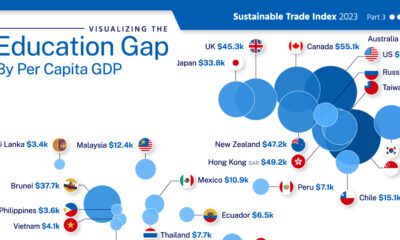
Visualizing the Global Education Gap
This graphic adds visual context to the global education gap, using data from 29 major economies.
-
 Money2 years ago
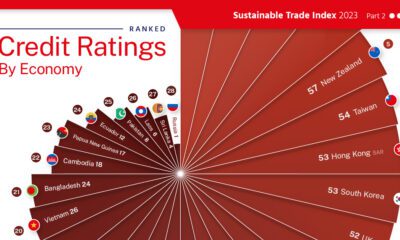
Ranking the Credit Ratings of Major Economies
This graphic visualizes 30 country’s credit ratings, using data from the 2023 Sustainable Trade Index.
-
 Economy2 years ago
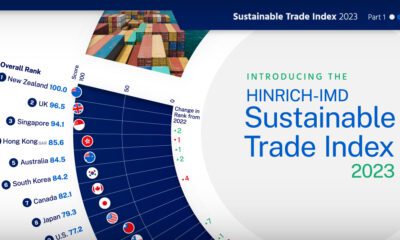
Ranked: The World’s Most Sustainable Economies in 2023
The Sustainable Trade Index 2023 is an annual ranking of the world’s most sustainable economies. View this infographic to see the results.
-
 Economy2 years ago
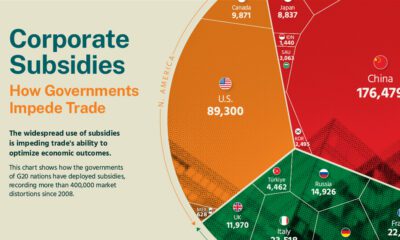
Visualizing the Impact of the G20’s Corporate Subsidies
The Hinrich Foundation visualizes the impact of corporate subsidies by G20 nations between 2008 and Q1 2023.
-
 Economy2 years ago
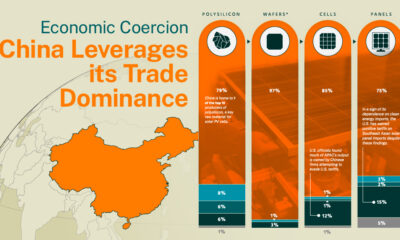
Economic Coercion: China’s Leverage in Trade
The Hinrich Foundation explores China’s use of economic coercion and the implications of its control over the solar energy sector.
-
 Politics2 years ago
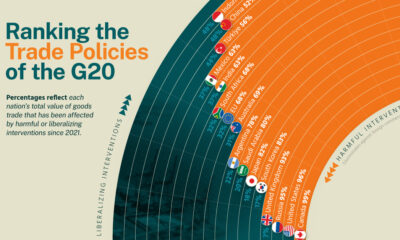
Ranking the Trade Policies of the G20
We analyze recent trade policies implemented by G20 members to determine whether they are liberalizing or harmful.
-
 Green2 years ago
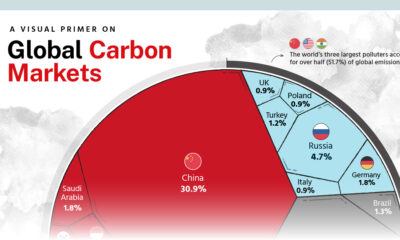
Global Carbon Markets: Highlights from the Latest Report
We highlight key findings from the Hinrich Foundation’s latest report on carbon markets, produced in partnership with Visual Capitalist.
-
 Green2 years ago
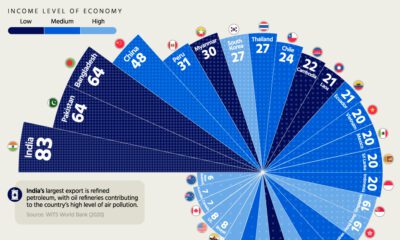
Ranked: Air Pollution by Economy
Which economies have hazy air, and which ones enjoy mostly clear skies? Find out in this geographic breakdown of air pollution levels.
-
 Politics3 years ago
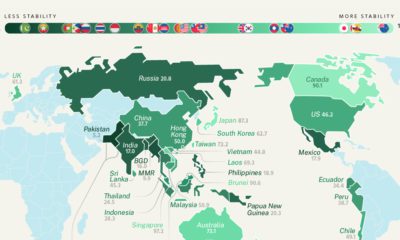
Mapped: Geopolitical Risk by Economy
Prior to invading Ukraine, Russia had one of the highest levels of geopolitical risk. How does geopolitical uncertainty vary around the world?
-
 Economy3 years ago
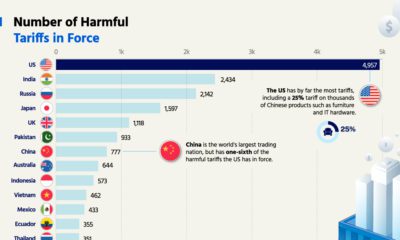
Ranked: Harmful Tariffs by Economy
The U.S. has by far the most harmful tariffs, with nearly 5,000 in force. Which economy has the least tariffs?
-
 Business3 years ago
Interested in a Career in Global Trade?
Global trade is growing across regions and countries which is creating an explosion in new jobs and education opportunities.
-
 Economy3 years ago
Introducing the 2022 Sustainable Trade Index
See which economies have the most sustainable trade policies in the Hinrich Foundation’s 2022 Sustainable Trade Index.
-
 Economy3 years ago
Global Trade Series: Fragmentation in the Digital Economy
In this infographic, we examine the current state of digital fragmentation and it’s implications on the world.
-
 Economy3 years ago
Global Trade Series: Asia’s Digital Economy
Asia’s digital economy is expanding quicker than ever, but cooperation between governments is needed to reduce barriers.
-
 Economy3 years ago
Global Trade Series: The Benefits of Free Trade
Free trade is a powerful engine for economic growth, but rising protectionism stands in the way. See what the data says in this infographic.