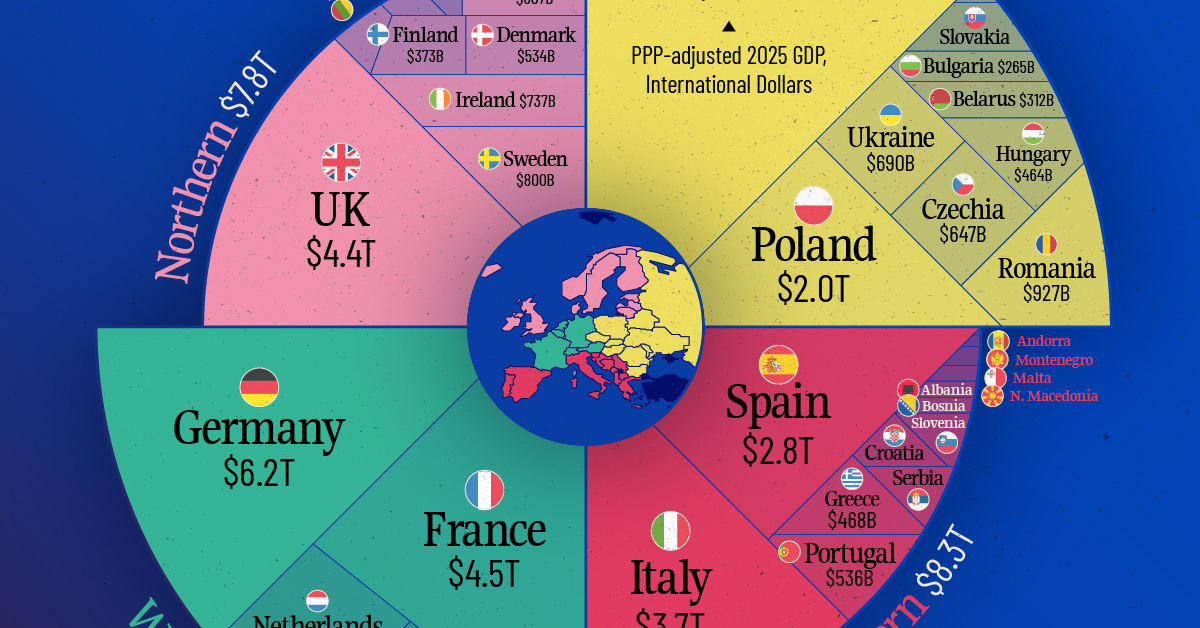
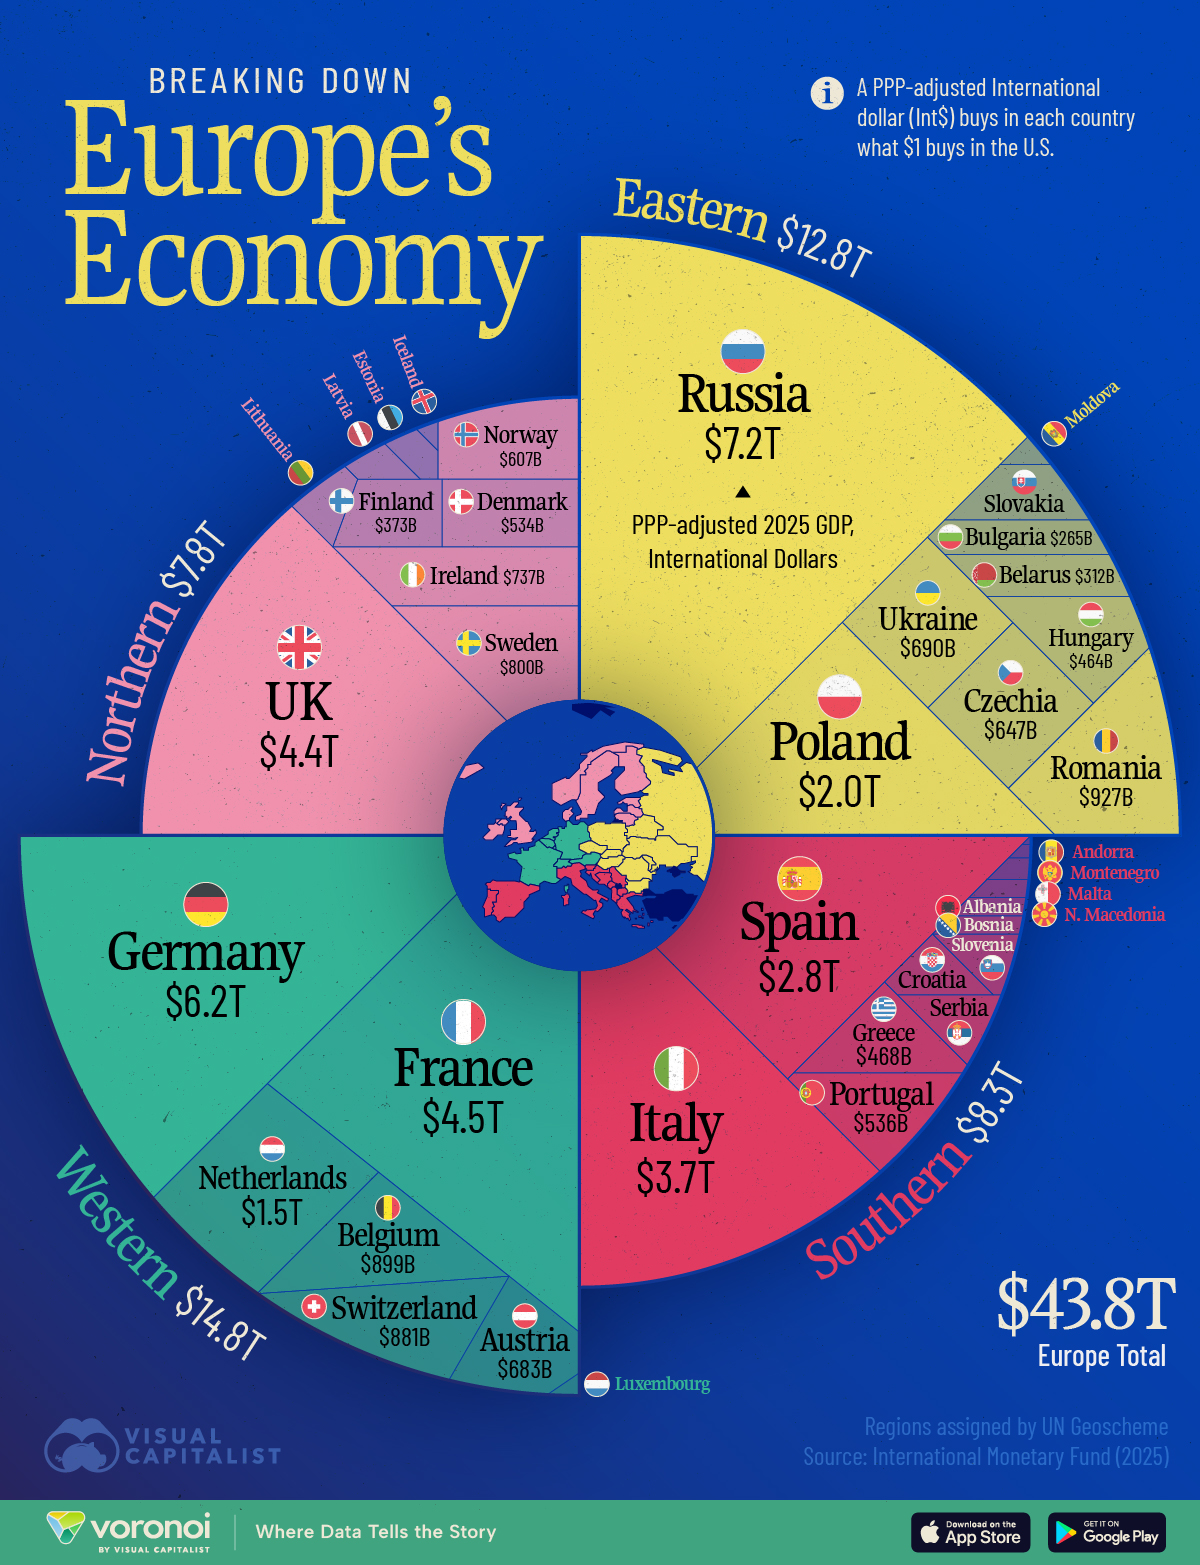
The Size of European Economies by GDP (PPP) in 2025
This was originally posted on our Voronoi app. Download the app for free on iOS or Android and discover incredible data-driven charts from a variety of trusted sources.
Key Takeaways
- Western Europe makes up the largest portion of the $43.8 trillion PPP-adjusted European economy, when measured in International dollars.
- Eastern Europe ($12.8T) outperforms both Northern ($7.8T) and Southern Europe ($8.3T) in PPP terms, helped in large part by the Russian economy ($7.2T).
- However, by nominal USD terms, Eastern Europe is the smallest ($4.6T), outweighed by just the Germany economy ($4.7T).
While many people picture Europe’s prosperity through the lens of its Western powerhouses, a closer look at Europe’s GDP by region reveals a more nuanced regional picture.
The visualization breaks down purchasing-power-parity (PPP)-adjusted output in 2025, showing how different parts of Europe contribute to the continent’s collective wealth.
The data for this visualization comes from the International Monetary Fund.
A PPP-adjusted GDP equalizes price levels across countries to provide a more apples-to-apples view of economic size.
It is measured in International dollars, (Int$) which can hypothetically buy in each country what $1 buys in America.
Regional classifications are sourced from the United Nations Geoscheme.
European Countries by 2025 GDP, Adjusted for Living Costs
In PPP terms, the center of gravity shifts markedly eastward in Europe.
Russia’s Int$7.2 trillion PPP economy props up an Eastern European total of nearly Int$12.9 trillion, leapfrogging both Northern and Southern Europe.
| Rank | Country | ISO Code | 2025 GDP (PPP-Adjusted) |
|---|---|---|---|
| 1 |  Russia Russia |
RUS | Int$7.2T |
| 2 |  Germany Germany |
DEU | Int$6.2T |
| 3 |  France France |
FRA | Int$4.5T |
| 4 |  UK UK |
GBR | Int$4.4T |
| 5 |  Italy Italy |
ITA | Int$3.7T |
| 6 |  Spain Spain |
ESP | Int$2.8T |
| 7 |  Poland Poland |
POL | Int$2.0T |
| 8 |  Netherlands Netherlands |
NLD | Int$1.5T |
| 9 |  Romania Romania |
ROU | Int$926.8B |
| 10 |  Belgium Belgium |
BEL | Int$899.1B |
| 11 |  Switzerland Switzerland |
CHE | Int$881.1B |
| 12 |  Sweden Sweden |
SWE | Int$799.7B |
| 13 |  Ireland Ireland |
IRL | Int$736.7B |
| 14 |  Ukraine Ukraine |
UKR | Int$690.1B |
| 15 |  Austria Austria |
AUT | Int$682.9B |
| 16 |  Czechia Czechia |
CZE | Int$647.3B |
| 17 |  Norway Norway |
NOR | Int$606.6B |
| 18 |  Portugal Portugal |
PRT | Int$536.1B |
| 19 |  Denmark Denmark |
DNK | Int$533.8B |
| 20 |  Greece Greece |
GRC | Int$467.6B |
| 21 |  Hungary Hungary |
HUN | Int$464.4B |
| 22 |  Finland Finland |
FIN | Int$373.2B |
| 23 |  Belarus Belarus |
BLR | Int$311.8B |
| 24 |  Bulgaria Bulgaria |
BGR | Int$264.7B |
| 25 |  Slovakia Slovakia |
SVK | Int$257.0B |
| 26 |  Serbia Serbia |
SRB | Int$216.2B |
| 27 |  Croatia Croatia |
HRV | Int$198.3B |
| 28 |  Lithuania Lithuania |
LTU | Int$165.4B |
| 29 |  Slovenia Slovenia |
SVN | Int$123.5B |
| 30 |  Luxembourg Luxembourg |
LUX | Int$104.8B |
| 31 |  Latvia Latvia |
LVA | Int$83.3B |
| 32 |  Bosnia & Herzegovina Bosnia & Herzegovina |
BIH | Int$78.7B |
| 33 |  Estonia Estonia |
EST | Int$68.2B |
| 34 |  Albania Albania |
ALB | Int$63.1B |
| 35 |  North Macedonia North Macedonia |
MKD | Int$53.3B |
| 36 |  Moldova Moldova |
MDA | Int$46.4B |
| 37 |  Malta Malta |
MLT | Int$43.2B |
| 38 |  Iceland Iceland |
ISL | Int$31.8B |
| 39 |  Montenegro Montenegro |
MNE | Int$21.3B |
| 40 |  Andorra Andorra |
AND | Int$6.4B |
| 41 |  San Marino San Marino |
SMR | Int$2.9B |
Here are also the regions in GDP (PPP) terms, also in International dollars.
| Rank | Region | 2025 GDP (PPP-Adjusted) |
|---|---|---|
| 1 | Western Europe | Int$14.8T |
| 2 | Eastern Europe | Int$12.8T |
| 3 | Southern Europe | Int$8.3T |
| 4 | Northern Europe | Int$7.8T |
| n/a |  Europe Europe |
Int$43.8T |
Lower price levels in countries such as Poland, Romania, and the Czech Republic strengthen local purchasing power, magnifying their contribution when adjusted for cost of living.
This underscores how traditional dollar-based metrics can understate economic heft in lower-cost regions.
European Economic Power in Nominal Terms
When measured in U.S. dollars, or nominal terms, Western Europe’s output is unmistakably dominant.
Germany alone is on track for a $4.7 trillion economy in 2025, which is larger than Eastern Europe’s collective share in USD ($4.6 trillion).
| Rank | Country | ISO Code | 2025 GDP (nominal) |
|---|---|---|---|
| 1 | Germany |
DEU | $4.7T |
| 2 | UK |
GBR | $3.8T |
| 3 | France |
FRA | $3.2T |
| 4 | Italy |
ITA | $2.4T |
| 5 | Russia |
RUS | $2.1T |
| 6 | Spain |
ESP | $1.8T |
| 7 | Netherlands |
NLD | $1.3T |
| 8 | Poland |
POL | $980.0B |
| 9 | Switzerland |
CHE | $947.1B |
| 10 | Belgium |
BEL | $684.9B |
| 11 | Sweden |
SWE | $620.3B |
| 12 | Ireland |
IRL | $598.8B |
| 13 | Austria |
AUT | $534.3B |
| 14 | Norway |
NOR | $504.3B |
| 15 | Denmark |
DNK | $449.9B |
| 16 | Romania |
ROU | $403.4B |
| 17 | Czechia |
CZE | $360.2B |
| 18 | Portugal |
PRT | $321.4B |
| 19 | Finland |
FIN | $303.9B |
| 20 | Greece |
GRC | $267.3B |
| 21 | Hungary |
HUN | $237.1B |
| 22 | Ukraine |
UKR | $205.7B |
| 23 | Slovakia |
SVK | $147.0B |
| 24 | Bulgaria |
BGR | $117.0B |
| 25 | Croatia |
HRV | $99.0B |
| 26 | Luxembourg |
LUX | $96.6B |
| 27 | Serbia |
SRB | $92.5B |
| 28 | Lithuania |
LTU | $89.2B |
| 29 | Slovenia |
SVN | $75.2B |
| 30 | Belarus |
BLR | $71.6B |
| 31 | Latvia |
LVA | $45.5B |
| 32 | Estonia |
EST | $45.0B |
| 33 | Iceland |
ISL | $35.3B |
| 34 | Bosnia & Herzegovina |
BIH | $28.8B |
| 35 | Albania |
ALB | $28.4B |
| 36 | Malta |
MLT | $25.8B |
| 37 | Moldova |
MDA | $19.5B |
| 38 | North Macedonia |
MKD | $17.9B |
| 39 | Montenegro |
MNE | $8.6B |
| 40 | Andorra |
AND | $4.0B |
| 41 | San Marino |
SMR | $2.0B |
Regions, also in nominal U.S. dollars, are below:
| Rank | Region | 2025 GDP (Nominal) |
|---|---|---|
| 1 | Western Europe | $11.5T |
| 2 | Northern Europe | $6.5T |
| 3 | Southern Europe | $5.2T |
| 4 | Eastern Europe | $4.6T |
| n/a | Europe |
$27.8T |
Together, Western European nations—including UK and France—account for roughly $11.5 trillion, or 41% of Europe’s total nominal GDP.
Their advanced manufacturing bases, robust consumer markets, and strong trade networks keep the region at the top of the continent’s economic hierarchy.
A Continent of Divergent Growth Paths
Regional disparities hint at Europe’s evolving economic story.
Northern Europe, driven by resource-rich Norway and highly productive Sweden, punches above its population weight, while Southern Europe continues to recover from a decade of sluggish growth.
Meanwhile, several Central and Southeastern states—Poland, Romania, and Hungary among them—show some of the fastest GDP trajectories on the continent, signaling a gradual re-balancing of economic opportunity away from the historic core.
Learn More on the Voronoi App 
If you enjoyed today’s post, check out The $115 Trillion World Economy in One Chart on Voronoi, the new app from Visual Capitalist.