
Ranked: The Largest Immigrant Groups in America
This was originally posted on our Voronoi app. Download the app for free on iOS or Android and discover incredible data-driven charts from a variety of trusted sources.
Key Takeaways
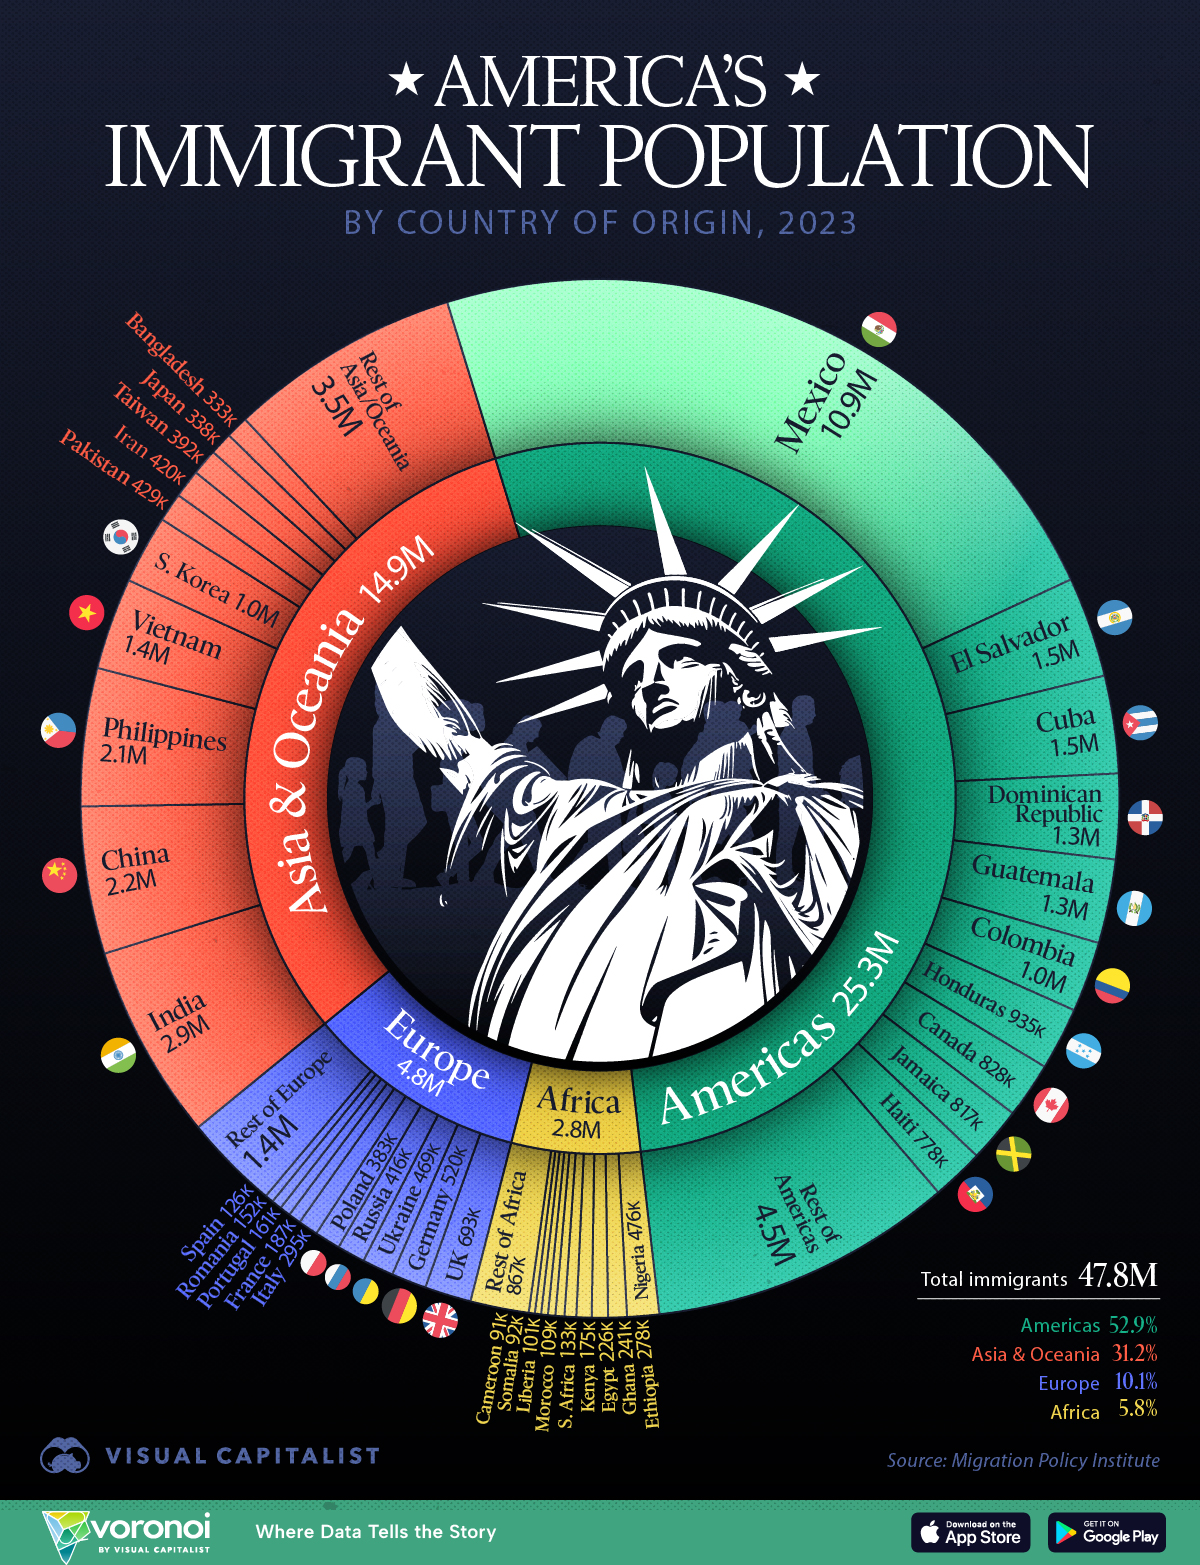
- America’s total foreign-born population was 47.8 million people as of 2023.
- Mexico is the largest source of immigrants by a huge margin, with other leading sources including India, China, and the Philippines.
The U.S. has long been a top destination for immigrants seeking better opportunities. As of 2023, nearly 48 million people in the country were born abroad, representing 14% of the country’s total population.
In this visualization, we break down the largest immigrant groups in America by nationality, highlighting the top 10 countries from each region. Note that this analysis covers legal immigrants only. Check out our previous post to see a similar breakdown of illegal immigrants coming into the U.S.
Data & Discussion
The data for this visualization comes from the Migration Policy Institute (MPI). It shows the number of foreign-born U.S. residents by country of origin, as of 2023.
Americas: 25.3M Immigrants
Mexico stands out as the dominant source of U.S. immigrants, with nearly 11 million as of 2023. Historical ties, geographic proximity, and longstanding migration channels are major factors.
Several other Latin American countries rank highly, including El Salvador, Cuba, and the Dominican Republic.
| Country | Immigrants |
|---|---|
 Mexico Mexico |
10,918,205 |
 El Salvador El Salvador |
1,494,869 |
 Cuba Cuba |
1,450,808 |
 Dominican Republic Dominican Republic |
1,265,231 |
 Guatemala Guatemala |
1,250,053 |
 Colombia Colombia |
1,049,821 |
 Honduras Honduras |
934,617 |
 Canada Canada |
828,396 |
 Jamaica Jamaica |
817,294 |
 Haiti Haiti |
777,845 |
 Other Americas Other Americas |
4,528,390 |
Asia: 14.9M Immigrants
After the Americas, Asia & Oceania is the next largest source of U.S. immigrants.
| Country | Immigrants |
|---|---|
 India India |
2,910,042 |
 China China |
2,193,250 |
 Philippines Philippines |
2,051,900 |
 Vietnam Vietnam |
1,365,841 |
 Korea Korea |
1,017,250 |
 Pakistan Pakistan |
428,795 |
 Iran Iran |
419,885 |
 Taiwan Taiwan |
392,012 |
 Japan Japan |
337,877 |
 Bangladesh Bangladesh |
333,026 |
 Rest of Asia/Oceania Rest of Asia/Oceania |
3,455,271 |
India (2.9 million) is the second-largest country source after Mexico, while China (2.2 million) and the Philippines (2.05 million) also rank in the top five.
In 2024, Indian students accounted for nearly 30% of all international students in the U.S.
Europe: 4.8M Immigrants
While Europe was once the primary source of immigrants to America, its share has declined over time. The combined European total remains substantial, though spread across many countries.
| Country | Immigrants |
|---|---|
 UK UK |
693,465 |
 Germany Germany |
520,418 |
 Ukraine Ukraine |
468,780 |
 Russia Russia |
415,809 |
 Poland Poland |
382,844 |
 Italy Italy |
295,002 |
 France France |
187,003 |
 Portugal Portugal |
160,729 |
 Romania Romania |
152,470 |
 Spain Spain |
126,067 |
 Rest of Europe Rest of Europe |
1,416,462 |
Africa: 2.8M Immigrants
Africa is the region with the least amount of immigrants living in America.
| Country | Immigrants |
|---|---|
 Nigeria Nigeria |
476,008 |
 Ethiopia Ethiopia |
278,182 |
 Ghana Ghana |
241,477 |
 Egypt Egypt |
225,665 |
 Kenya Kenya |
174,734 |
 South Africa South Africa |
133,359 |
 Morocco Morocco |
109,370 |
 Liberia Liberia |
100,769 |
 Somalia Somalia |
92,401 |
 Cameroon Cameroon |
90,749 |
| Rest of Africa |
868,612 |
According to historical MPI data, the annual number of new permanent residents from Africa has grown slowly and inconsistently. This could be due to closer ties between Africa and China.
Learn More on the Voronoi App 
If you enjoyed today’s post, check out Why Did Asian Immigrants Come to the U.S.? on Voronoi, the new app from Visual Capitalist.