Electricity Demand Per Capita in Major Global Economies
This was originally posted on our Voronoi app. Download the app for free on iOS or Android and discover incredible data-driven charts from a variety of trusted sources.
Key Takeaways
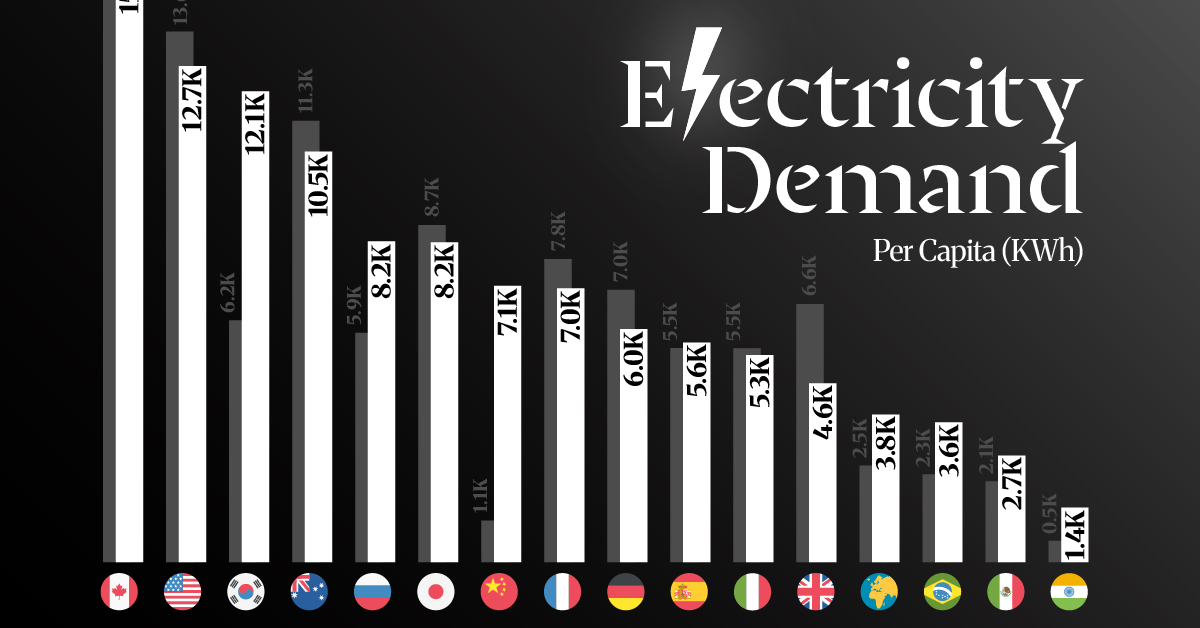
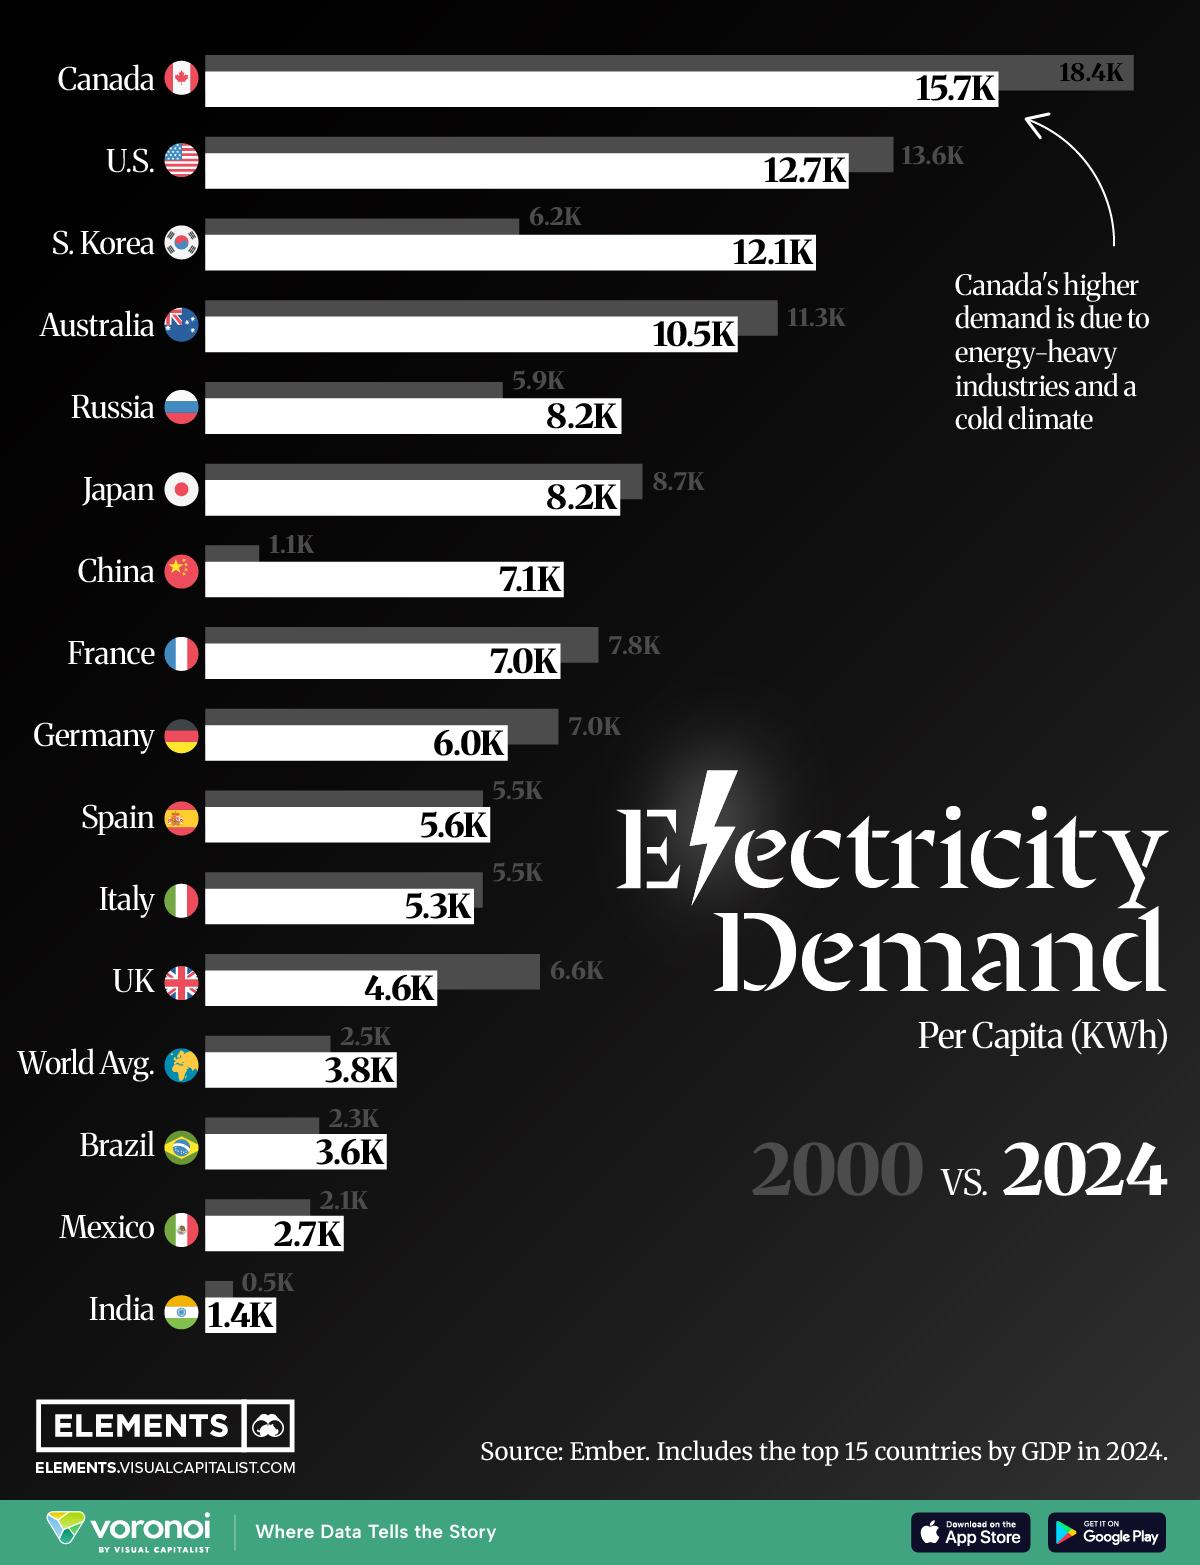
- Of major economies, Canada leads in electricity use per person, staying above 15,000 kWh—driven by its energy-intensive industries and cold climate.
- China’s per capita electricity demand has surged over the past two decades, surpassing that of the UK by 2024.
As countries develop, their electricity demands tend to rise sharply, especially in industrial and urban areas.
This visualization highlights how electricity consumption per person compares across the world’s major economies. It also shows how these patterns have evolved in recent decades, with some surprising shifts.
The data for this visualization comes from Ember’s Electricity Data Explorer. It shows 2024 per capita electricity consumption across major global economies, compared to 2000 figures.
Canada and the U.S. Are at the Top
Canada ranks first in electricity use per person, with consumption at 15,708 kWh in 2024. This high level is due to energy-intensive industries like mining and aluminum production, as well as heating needs during its long winters.
The United States follows at 12,741 kWh per person, reflecting the country’s sprawling infrastructure, high air-conditioning use, and heavy industry.
China’s Rapid Growth in Demand
China’s per capita electricity use reached 7,097 kWh in 2024, compared to 1,061 kWh in 2000. This rise has been fueled by industrialization, urbanization, and rising living standards.
| Rank | Country | 2000 Demand per capita (kWh) |
2024 Demand per capita (kWh) |
Change |
|---|---|---|---|---|
| 1 |  Canada Canada |
18,386 | 15,708 | -14.6% |
| 2 |  US US |
13,627 | 12,741 | -6.5% |
| 3 |  South Korea South Korea |
6,211 | 12,092 | +94.7% |
| 4 |  Australia Australia |
11,333 | 10,543 | -7.0% |
| 5 |  Russia Russia |
5,887 | 8,237 | +39.9% |
| 6 |  Japan Japan |
8,657 | 8,213 | -5.1% |
| 7 |  China China |
1,061 | 7,097 | +568.9% |
| 8 |  France France |
7,785 | 7,028 | -9.7% |
| 9 |  Germany Germany |
6,993 | 5,984 | -14.4% |
| 10 |  Spain Spain |
5,494 | 5,639 | +2.6% |
| 11 |  Italy Italy |
5,488 | 5,316 | -3.1% |
| 12 |  United Kingdom United Kingdom |
6,625 | 4,590 | -30.7% |
| 13 |  Brazil Brazil |
2,252 | 3,589 | +59.4% |
| 14 |  Mexico Mexico |
2,073 | 2,736 | +32.0% |
| 15 |  India India |
541 | 1,397 | +158.2% |
 World World |
2,476 | 3,788 | +53.0% |
Notably, China now consumes more electricity per person than the UK, France, and even Germany.
Europe and Developing Countries Lag Behind
Most European countries fall in the mid-range, with Germany at 5,984 kWh and the UK at just 4,590 kWh per capita.
Developing countries like India (1,397 kWh) and Mexico (2,736 kWh) remain far below the global average of 3,788 kWh per person. As these countries develop, their electricity consumption is expected to rise steadily.
Learn More on the Voronoi App 
If you enjoyed today’s post, check out What Powered the World in 2024? on Voronoi, the new app from Visual Capitalist.