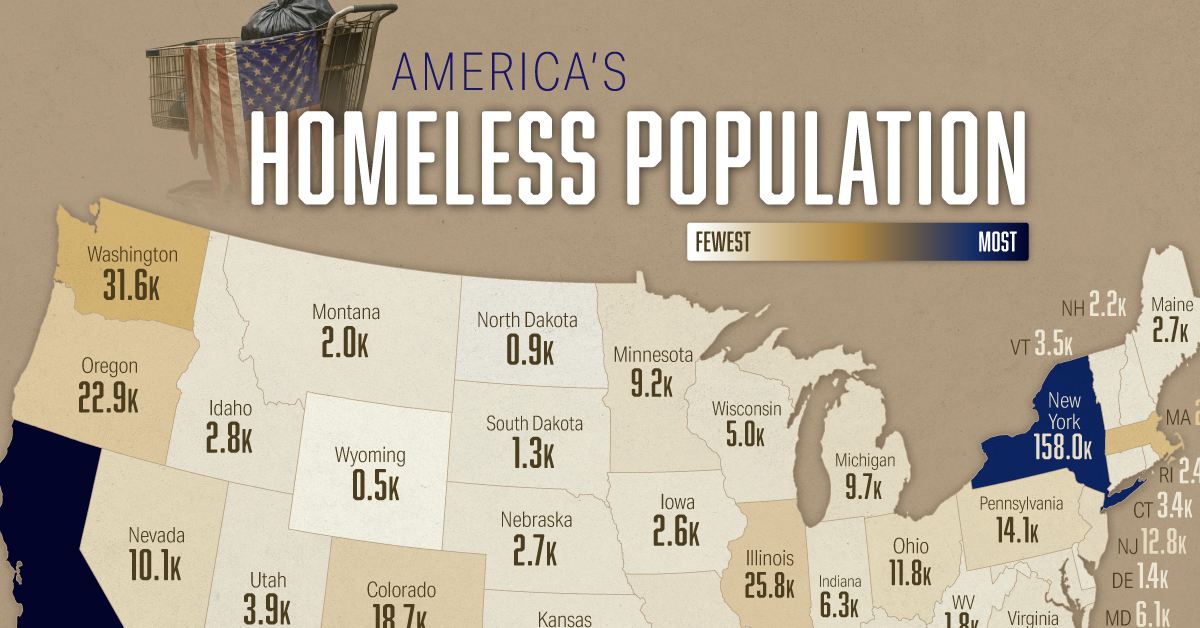
See this visualization first on the Voronoi app. Use This Visualization Mapped: America’s Homeless Population by State This was originally posted on our Voronoi app. Download the app for free on iOS or Android and discover incredible data-driven charts from a variety of trusted sources. Key Takeaways California—also the most populous state—has the largest homeless… Continua a leggere Mapped: America’s Homeless Population by State