See this visualization first on the Voronoi app. Use This Visualization Mapped: Where Americans Receive Social Security, by State This was originally posted on our Voronoi app. Download the app for free on iOS or Android and discover incredible data-driven charts from a variety of trusted sources. Key Takeaways States with older populations (Maine, West… Continua a leggere Mapped: Where Americans Receive Social Security, by State
Ranked: Electricity Use Per Capita in Major Global Economies
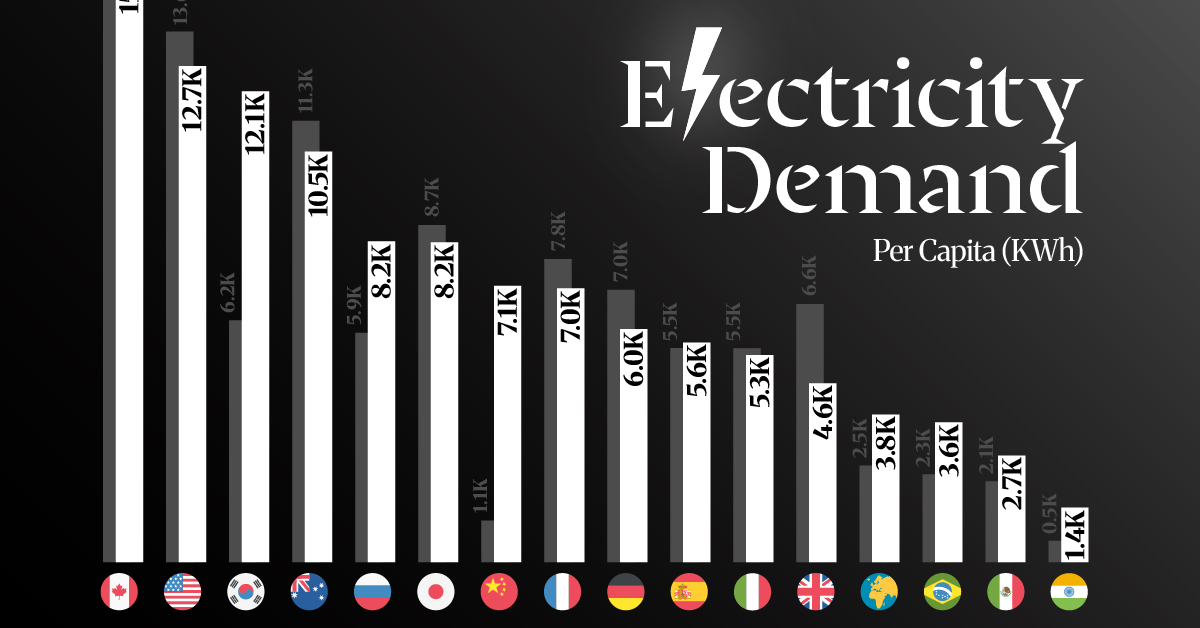
See this visualization first on the Voronoi app. Use This Visualization Electricity Demand Per Capita in Major Global Economies This was originally posted on our Voronoi app. Download the app for free on iOS or Android and discover incredible data-driven charts from a variety of trusted sources. Key Takeaways Of major economies, Canada leads in… Continua a leggere Ranked: Electricity Use Per Capita in Major Global Economies