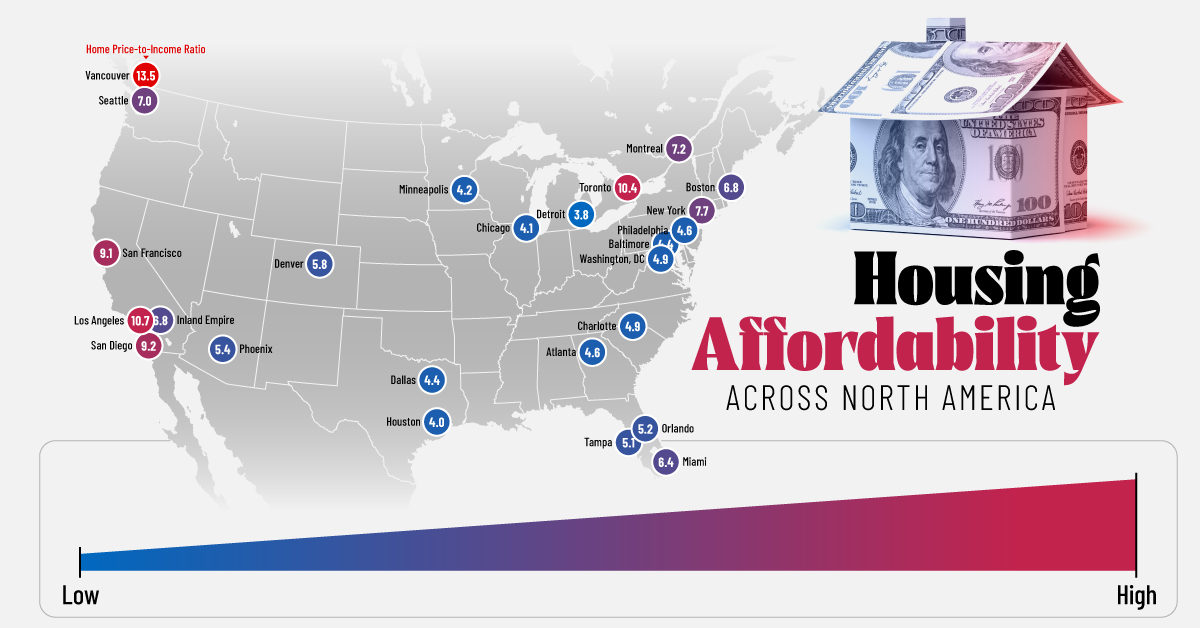
See this visualization first on the Voronoi app. Use This Visualization Mapped: Housing Affordability Across North America in 2025 This was originally posted on our Voronoi app. Download the app for free on iOS or Android and discover incredible data-driven charts from a variety of trusted sources. Key Takeaways Vancouver, Canada is the most unaffordable… Continua a leggere Mapped: Housing Affordability Across North America in 2025
Visualized: Men’s vs. Women’s Earnings in the U.S.

See this visualization first on the Voronoi app. Use This Visualization Visualized: Men’s vs. Women’s Earnings in the U.S. This was originally posted on our Voronoi app. Download the app for free on iOS or Android and discover incredible data-driven charts from a variety of trusted sources. The gender pay gap continues to be a… Continua a leggere Visualized: Men’s vs. Women’s Earnings in the U.S.