![]() See this visualization first on the Voronoi app.
See this visualization first on the Voronoi app.
Charted: How U.S. Trade Has Changed With Its Allies (1985-2024)
This was originally posted on our Voronoi app. Download the app for free on iOS or Android and discover incredible data-driven charts from a variety of trusted sources.
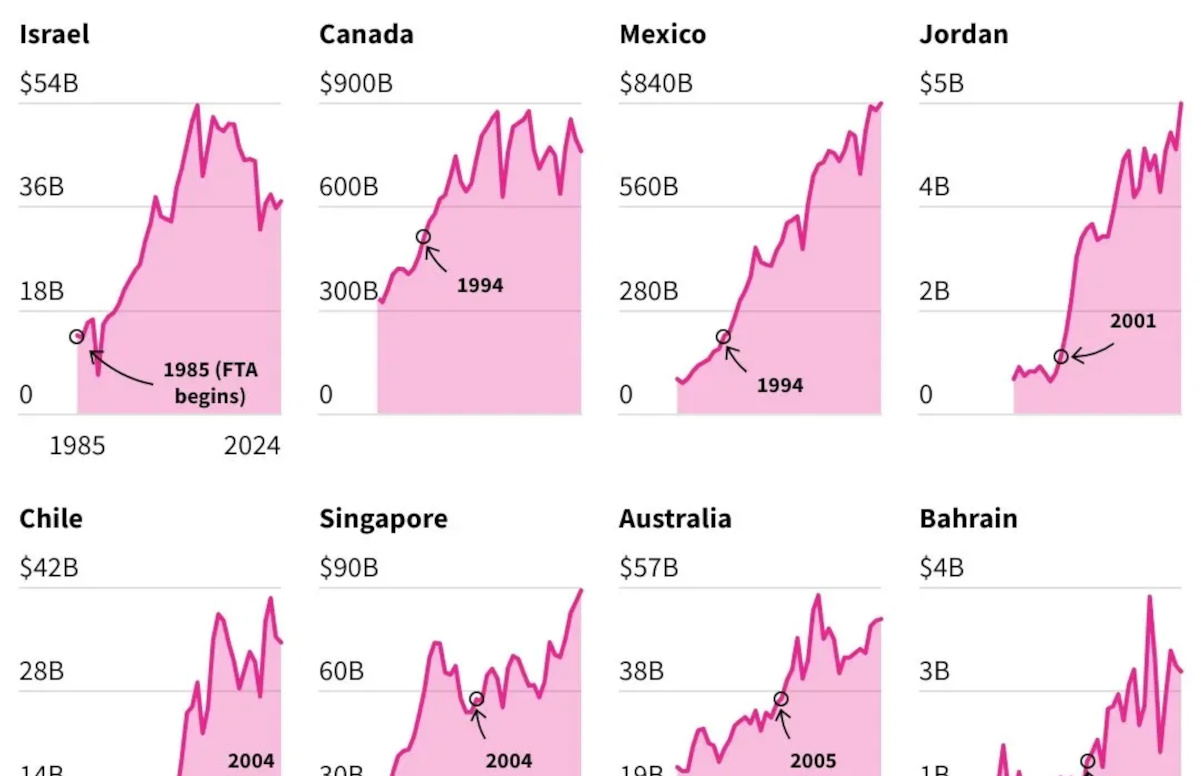
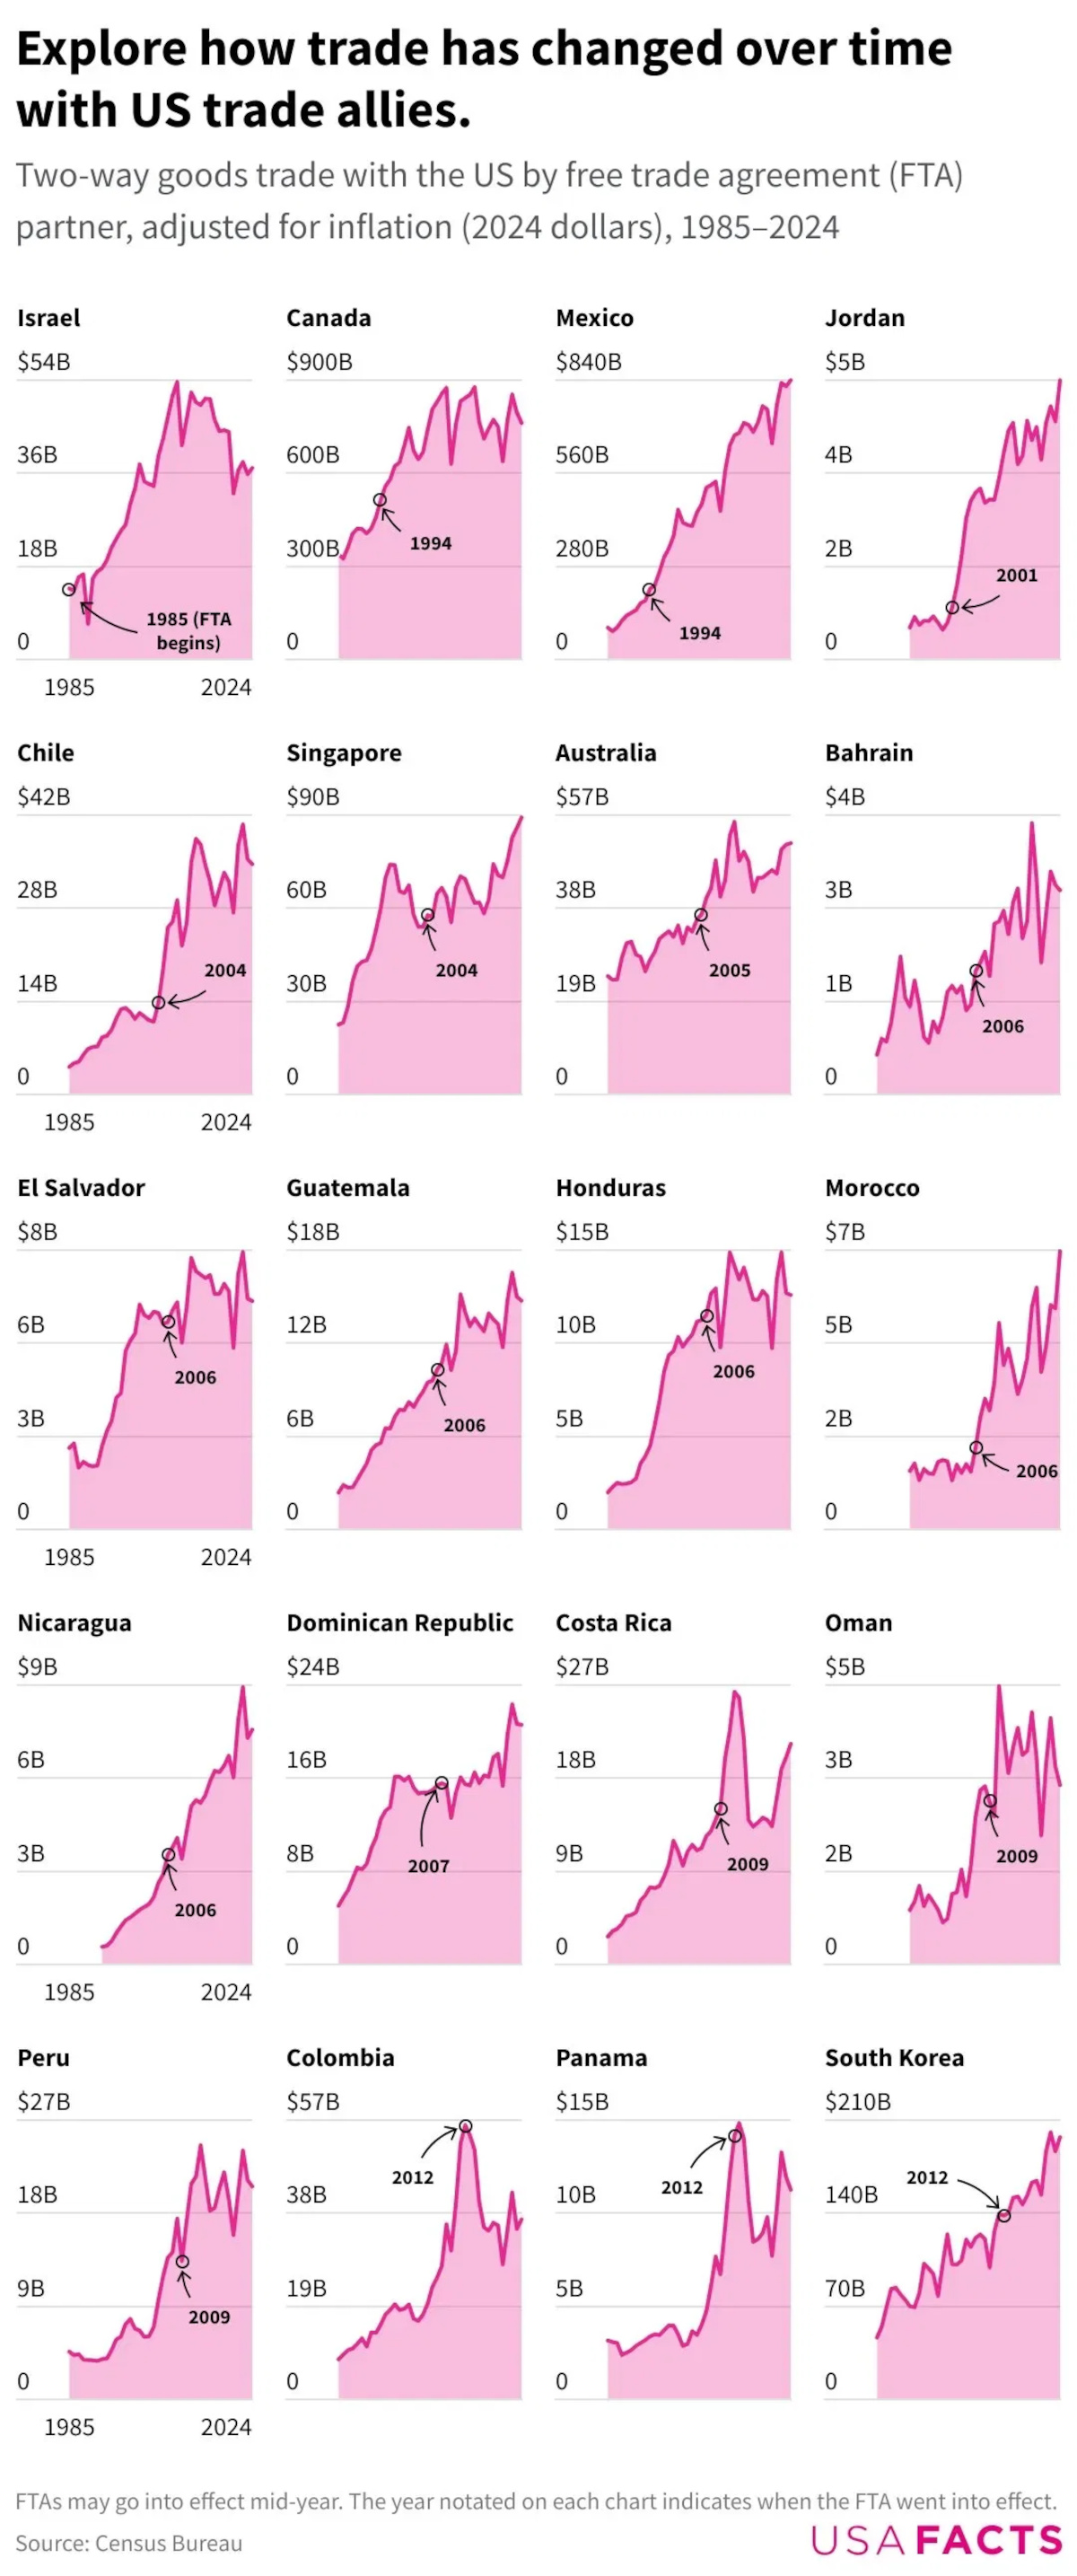
- Canada and Mexico—the U.S.’s largest trade partners—now account for almost $1.6 trillion in two-way goods trade, roughly 7x their 1985 level.
- CAFTA-DR members like Nicaragua and Guatemala saw 6–13x growth, showing how even modest free trade agreements (FTAs) can unlock sizable relative gains.
- Trade often accelerates after a deal takes effect; South Korea’s 2012 agreement, for instance, preceded a 50% jump in bilateral trade within a decade.
The United States has 14 active free-trade agreements (FTAs) that cover 20 partner nations. By cutting tariffs and aligning standards, these pacts aim to boost commerce while avoiding the tit-for-tat escalation common in trade wars.
Data and Analysis
Below is the inflation-adjusted two-way goods trade between the U.S. and each FTA partner from 1985–2024, compiled by the U.S. Census Bureau and visualized by USAFacts.
| Bilateral Trade by U.S. Free Trade Partner (Millions of U.S. dollars) | |||||
|---|---|---|---|---|---|
| Country | 1985 | 1994 | 2004 | 2014 | 2024 |
 Israel Israel |
$13,708 | $21,643 | $39,391 | $50,458 | $37,010 |
 Canada Canada |
$338,928 | $514,019 | $741,030 | $877,325 | $762,056 |
 Mexico Mexico |
$95,525 | $212,380 | $442,773 | $711,208 | $839,892 |
 Jordan Jordan |
n/a | $669 | $2,732 | $4,573 | $5,396 |
 Chile Chile |
$4,161 | $9,724 | $13,847 | $34,479 | $34,637 |
 Singapore Singapore |
$22,551 | $60,066 | $57,736 | $61,707 | $89,236 |
 Australia Australia |
$24,129 | $27,480 | $35,709 | $49,529 | $51,279 |
 Bahrain Bahrain |
$555 | $1,252 | $1,174 | $2,684 | $2,851 |
 El Salvador El Salvador |
$2,452 | $3,260 | $6,510 | $7,558 | $6,868 |
 Guatemala Guatemala |
$2,372 | $5,577 | $9,474 | $13,600 | $14,735 |
 Honduras Honduras |
$1,992 | $4,465 | $11,157 | $14,055 | $12,590 |
 Morocco Morocco |
n/a | $1,271 | $1,683 | $4,103 | $7,174 |
 Nicaragua Nicaragua |
n/a | $747 | $2,628 | $5,451 | $7,563 |
 Dominican Republic Dominican Republic |
$5,027 | $12,466 | $14,755 | $16,505 | $20,587 |
 Costa Rica Costa Rica |
$2,691 | $7,444 | $11,025 | $21,814 | $21,312 |
 Oman Oman |
n/a | $1,434 | $1,242 | $3,965 | $3,274 |
 Peru Peru |
$4,614 | $4,760 | $9,636 | $21,379 | $20,587 |
 Colombia Colombia |
$8,158 | $15,315 | $19,531 | $50,859 | $36,728 |
 Panama Panama |
$3,164 | $3,385 | $3,468 | $14,008 | $11,258 |
 South Korea South Korea |
$46,557 | $79,702 | $120,153 | $151,489 | $197,091 |
Canada and Mexico dominate the dollar totals, but the fastest percentage growth belongs to smaller Central American partners, while Bahrain and Jordan remain the smallest markets despite solid gains.
NAFTA, CAFTA-DR, and Beyond
The 1994 North American Free Trade Agreement (now USMCA) was a watershed. U.S.–Mexico trade rose from about $95 billion in 1985 to roughly $840 billion today, while Canada followed a similar—and larger—trajectory, reinforcing why America’s neighbors are its commercial backbone.
CAFTA-DR’s 2006 launch opened new export channels for Nicaragua, Honduras, and Guatemala, particularly in apparel and agriculture, that would otherwise have faced steep duties.
Strategic Spikes and Volatility
Not every line rises in a straight line. Colombia’s 2012 pact coincided with a surge fueled by energy exports, only to ease as oil prices softened. Bahrain’s values swing widely year-to-year because of its narrow economic base.
Collectively, FTA partners capture about 40% of U.S. goods exports—an impressive share given they account for just 6% of global GDP. The trend also aligns with a long-term decline in the average U.S. tariff rate.
Learn More on the Voronoi App 
How has trade changed on a global scale? Look at The Rise and Evolution of Global Trade Openness (1960–2023) on the Voronoi App for more.