Charted: The End-of-Life Recycling Rates of Select Metals
This was originally posted on our Voronoi app. Download the app for free on Apple or Android and discover incredible data-driven charts from a variety of trusted sources.
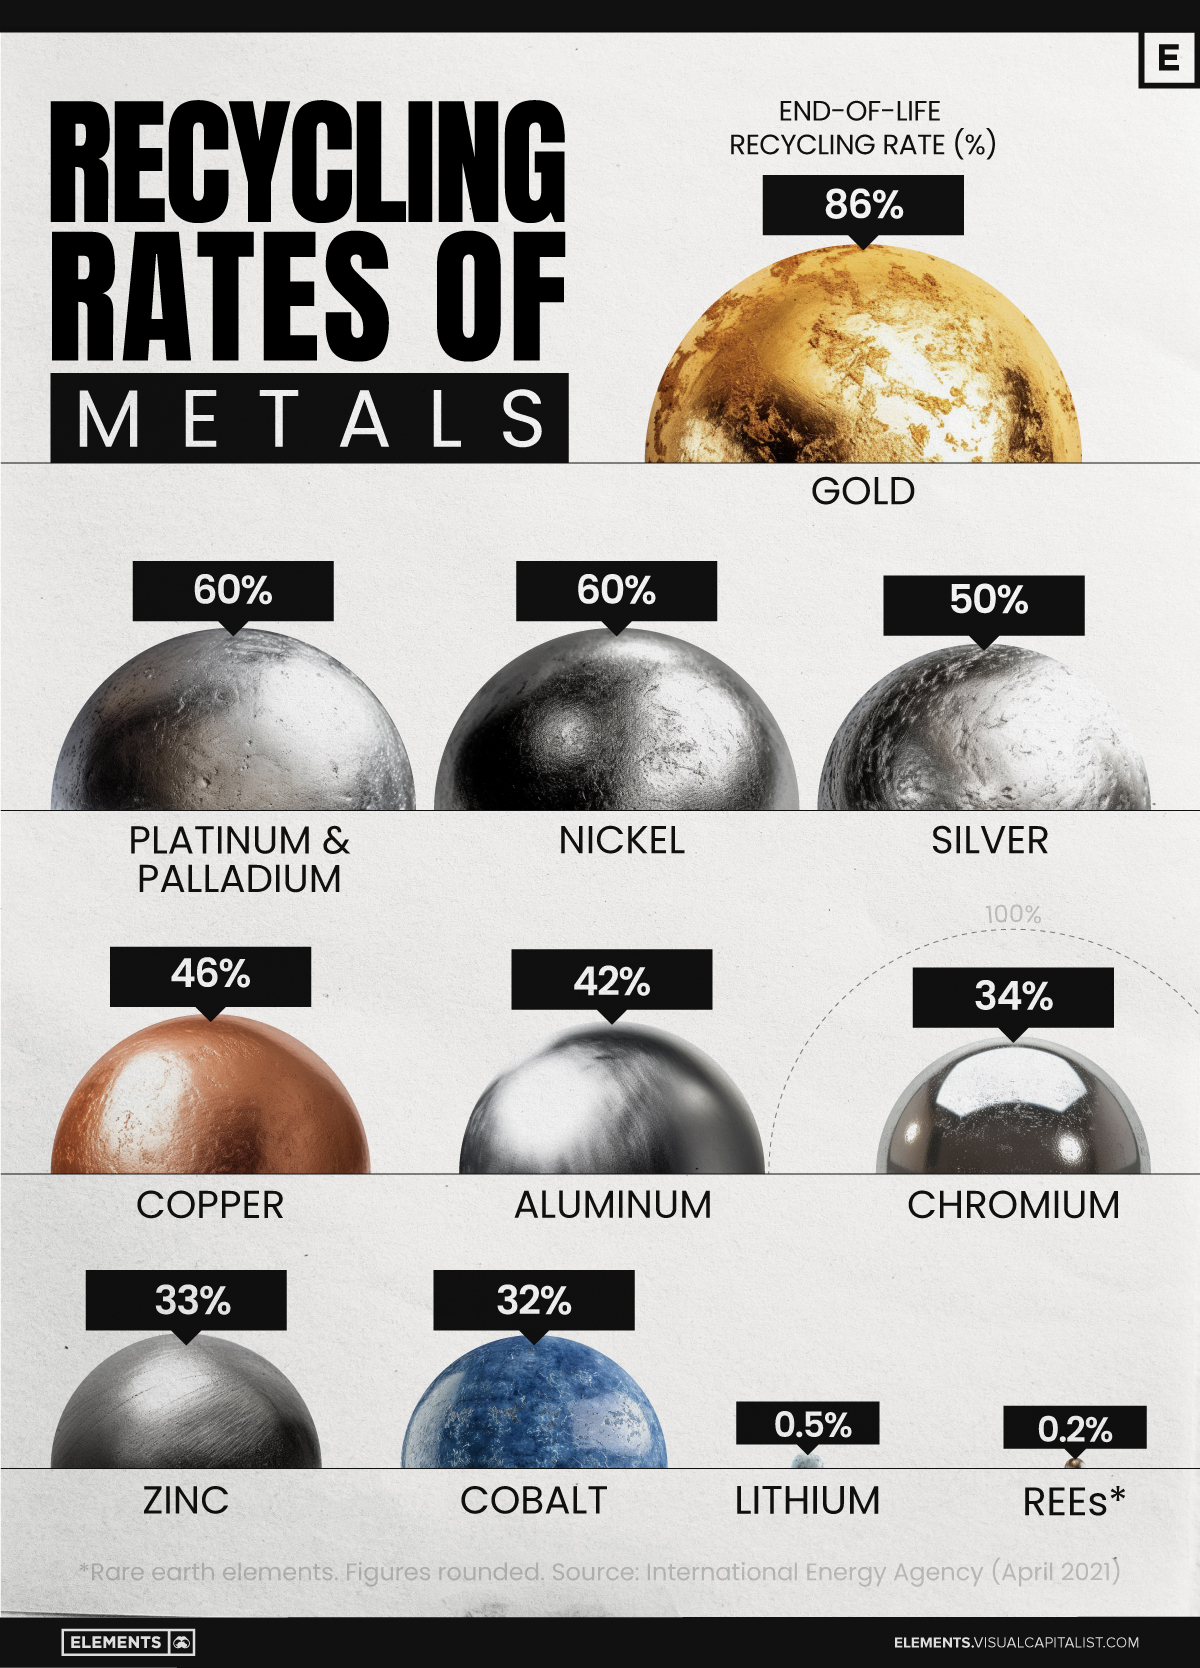
We visualize the end-of-life recycling rates (EOL-RR) of commonly used metals in the economy. Data is sourced from the International Energy Agency, last updated in 2021.
 EOL-RR is the percentage of a material or product that is recycled or recovered at the end of its useful life, rather than being disposed of in landfills or incinerated.
Tracking recycling rates helps manage resources better and make smarter policies, guiding efforts to cut down on waste.
Ranked: The End of Life Recycling Rates of Select Metals
Gold has an 86% recycling rate according to the latest available data. Per the Boston Consulting Group, one-third of total gold supply was met through recycling between 1995–2014.
| Metal | End-of-life recycling rate (2021) |
 Used In Used In |
|---|---|---|
| Gold | 86% |  Jewelry / Electronics Jewelry / Electronics |
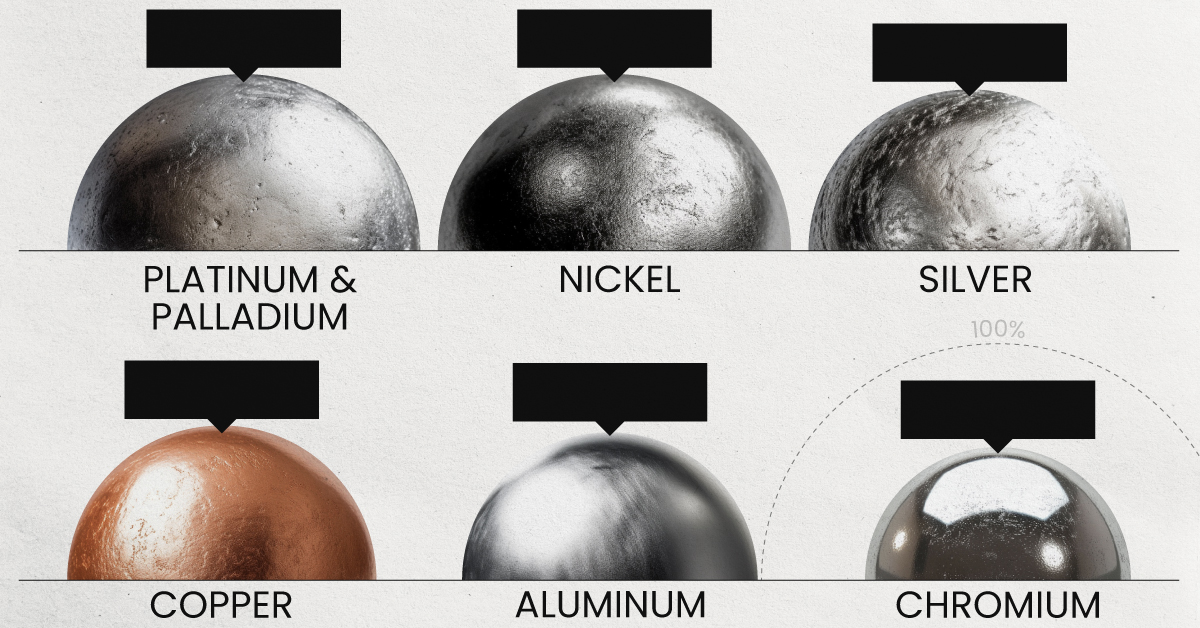
| Platinum/Palladium | 60% |  Optical fibers / Dental fillings Optical fibers / Dental fillings |
| Nickel | 60% |  Batteries / Turbine blades Batteries / Turbine blades |
| Silver | 50% | Jewelry / Mirrors |
| Copper | 46% |  Electrical wiring / Industrial equipment Electrical wiring / Industrial equipment |
| Aluminum | 42% |  Aeroplane parts / Cans Aeroplane parts / Cans |
| Chromium | 34% |  Stainless steel / Leather tanning Stainless steel / Leather tanning |
| Zinc | 33% |  Galvanizing metal / Making rubber Galvanizing metal / Making rubber |
| Cobalt | 32% | Batteries / Turbine engines |
| Lithium | 0.5% | Batteries / Pacemakers |
| REEs | 0.2% |  Mobile phones / Hard drives Mobile phones / Hard drives |
Note: Figures are rounded.
Several factors can influence metal recycling rates. According to this International Resource Panel report, metals that are used in large quantities (steel) or have a high value (gold) tend to have higher recycling rates.
However, for materials used in small quantities in complex products (REEs in electronics), recycling becomes far more challenging.
Finally, a metal’s EOL-RR is strongly influenced by the least efficient link in the recycling chain, which is typically how it’s initially collected.
Learn More on the Voronoi App 
If you enjoyed this post, check out Critical Materials: Where China, the EU, and the U.S. Overlap which shows how critical materials are classified within different jurisdictions.
The post Charted: The End-of-Life Recycling Rates of Select Metals appeared first on Visual Capitalist.