![]() See this visualization first on the Voronoi app.
See this visualization first on the Voronoi app.
Charted: Video Game Industry Revenue in the U.S. Over Time
This was originally posted on our Voronoi app. Download the app for free on iOS or Android and discover incredible data-driven charts from a variety of trusted sources.
Key Takeaways
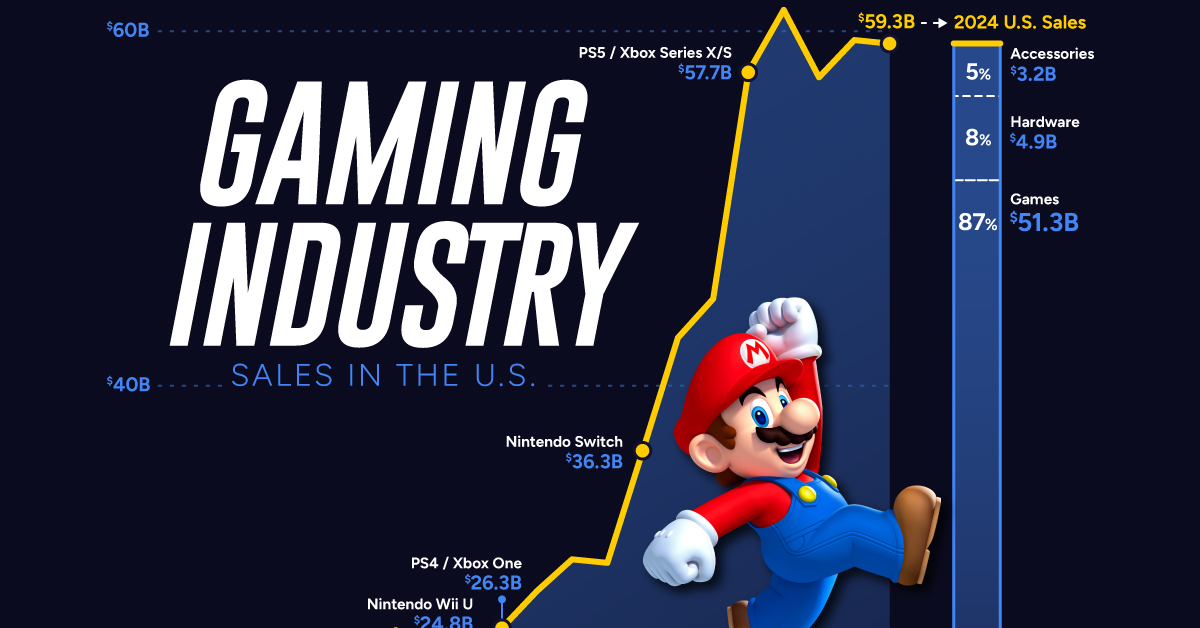
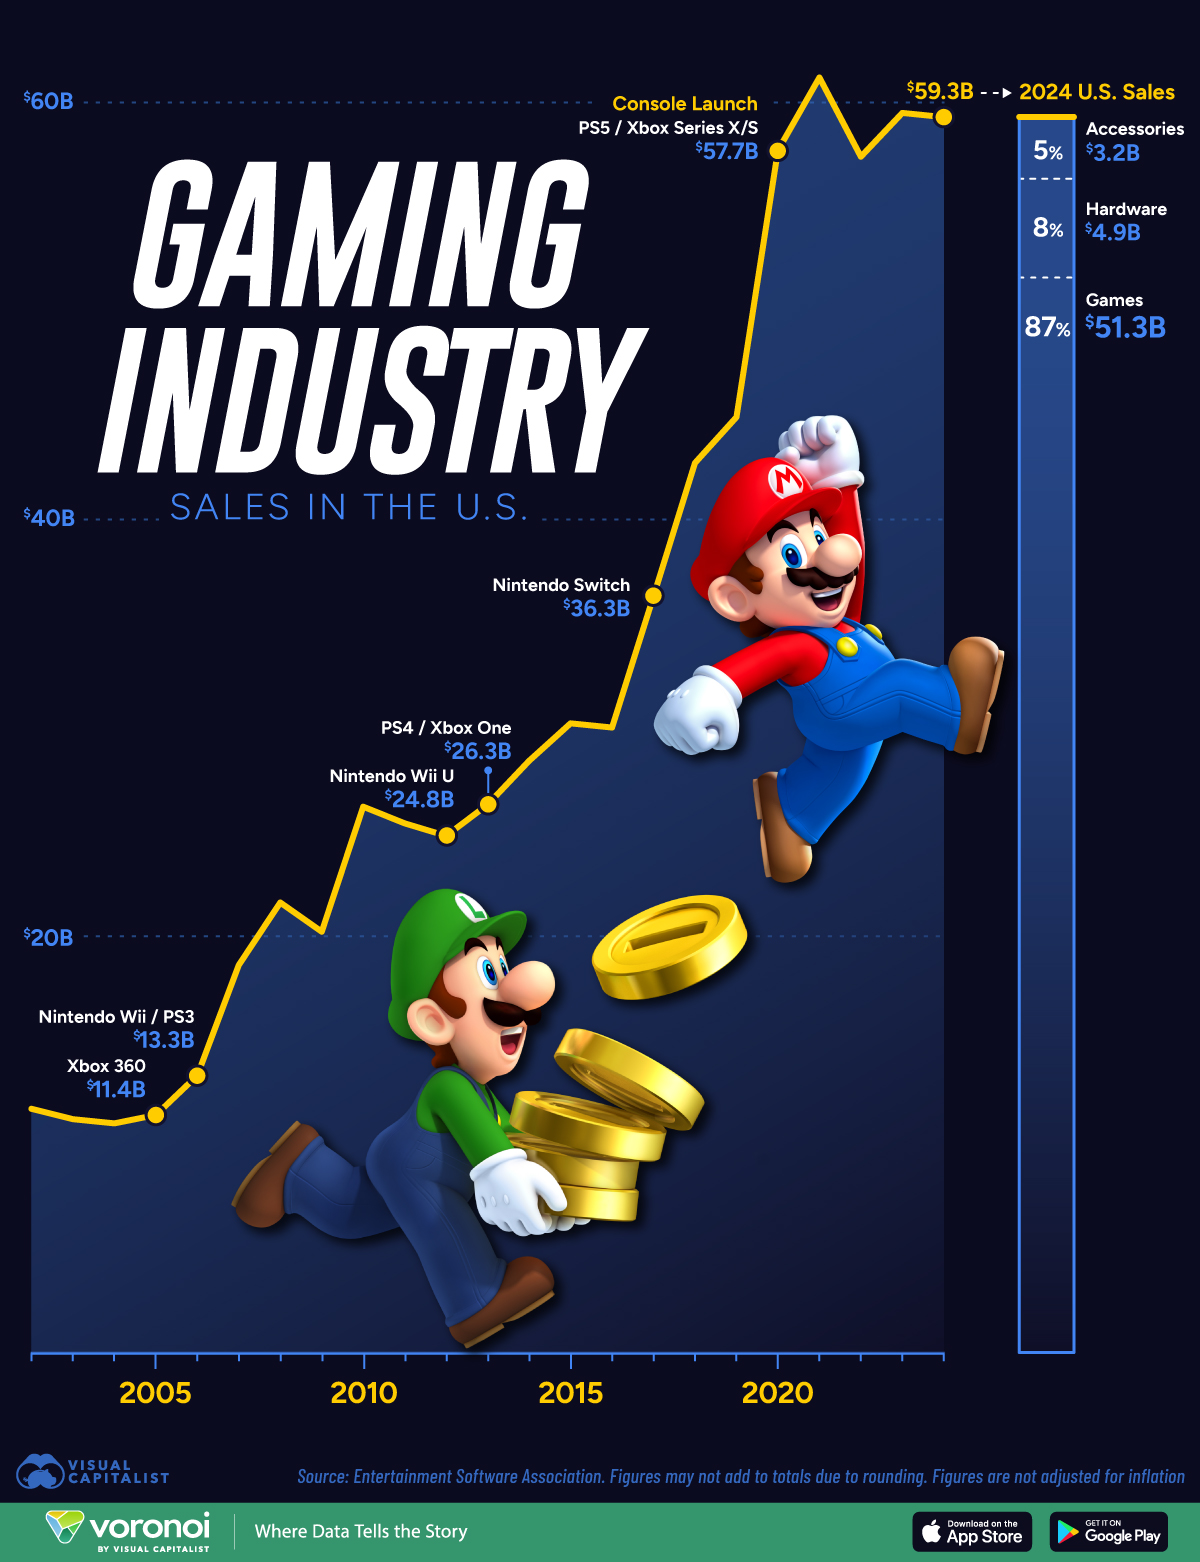
- U.S. gaming sales hit $59.3 billion in 2024, with 87% ($51.3B) coming from the games (software) themselves.
- The PS4, Xbox One, and Nintendo Switch generation saw game revenues more than double in the span of a decade, but since 2019 sales have shown little growth.
The U.S. video game industry has transformed dramatically over the past two decades, growing into a cultural and economic powerhouse.
This visualization charts the U.S. video game industry’s annual revenue from 2002 through 2024 (figures not adjusted for inflation) using data from the Entertainment Software Association.
Video Game Revenue Over Time
The data table below shows the annual revenue of the video game industry from 2002 to 2024, which includes the combined sales of video game software, hardware, and accessories in the United States. Note that these are nominal sales and are not adjusted for inflation.
| Year | U.S. Video game industry revenue |
|---|---|
| 2002 | $11.7B |
| 2003 | $11.2B |
| 2004 | $11.0B |
| 2005 | $11.4B |
| 2006 | $13.3B |
| 2007 | $18.6B |
| 2008 | $21.6B |
| 2009 | $20.2B |
| 2010 | $26.2B |
| 2011 | $25.4B |
| 2012 | $24.8B |
| 2013 | $26.3B |
| 2014 | $28.4B |
| 2015 | $30.2B |
| 2016 | $30.0B |
| 2017 | $36.3B |
| 2018 | $42.7B |
| 2019 | $44.9B |
| 2020 | $57.7B |
| 2021 | $61.2B |
| 2022 | $57.4B |
| 2023 | $59.5B |
| 2024 | $59.3B |
In the early 2000s, annual revenues hovered around $11 billion, but the rise of online gaming, mobile platforms, and digital distribution fueled a surge in consumer spending.
The arrival of the Xbox 360, PlayStation 3, and Nintendo Wii in the mid-2000s ushered in a wave of consumer excitement and broader adoption.
Annual video game revenue rose from $13.3 billion in 2006 to $21.4 billion in 2008, driven by blockbuster franchise starters like Gears of War, Assassin’s Creed, and Mass Effect, along with the first true online console ecosystems.
Video Game Revenues Double in the 2010s
The launch of the PlayStation 4 and Xbox One in 2013, along with the explosion of mobile gaming, drove industry revenue past $30 billion by 2014.
By 2018, sales had more than doubled compared to the early 2010s, topping $43 billion, and the introduction of the Nintendo Switch in 2017 provided another boost, attracting both casual and core gamers.
The pandemic years of 2020 and 2021 set revenue records, peaking at $61.2 billion in 2021 as lockdowns drove demand for digital entertainment. Since then, despite the launch of new consoles like the PS5 and Xbox Series X/S, annual sales have largely plateaued around $59 billion.
While the recent strong launch of the Nintendo Switch 2 could usher a new wave of sales, it’s uncertain if the U.S. video game industry will see another surge similar to the 2010s.
Learn More on the Voronoi App 
To learn more about the video game industry, check out this visualization of video game revenue by country on Voronoi, the new app from Visual Capitalist.