Home Affordability in OECD Countries Since 2015
This was originally posted on our Voronoi app. Download the app for free on iOS or Android and discover incredible data-driven charts from a variety of trusted sources.
Globally, housing inflation remains one of the most persistent price pressures, despite elevated interest rates that would typically cool the market.
In the U.S., housing unaffordability is nearing 2007 levels due to constrained supply and strong demand. In line with this trend, many markets such as Canada, Portugal, and the Netherlands have seen home prices surge in the post-pandemic era.
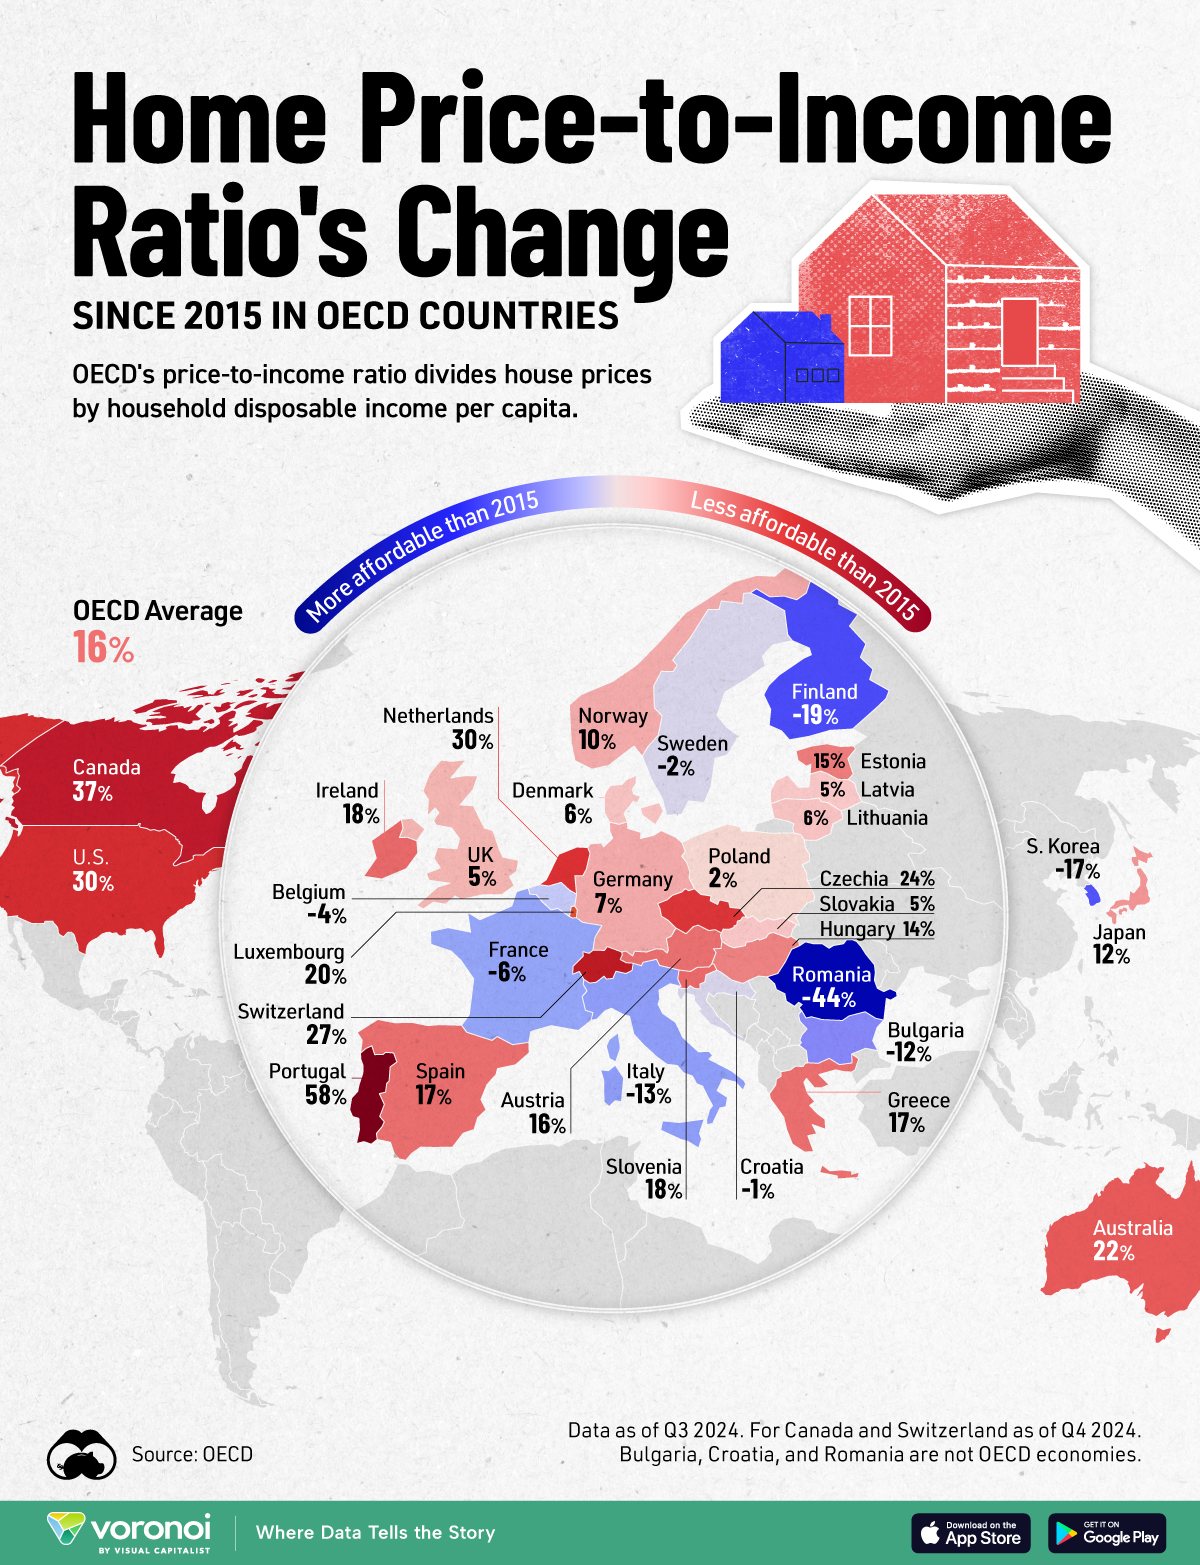
In this graphic, we show the home price-to-income ratio change since 2015, based on data from the OECD.
Ranked: Home Price-to-Income Changes Since 2015
The OECD’s price-to-income ratio measures housing affordability by dividing nominal house prices by net household disposable income per capita.
Net household disposable income per capita reflects the money left over after taxes and transfers to show the average spending available among citizens in a country. For perspective, U.S. net household disposable income per capita is $51,147 a year based on the OECD’s latest reading.
| Country | Home Price-to-Income Ratio Change 2015 to 2024 |
|---|---|
 Portugal Portugal |
58% |
 Canada Canada |
37% |
 United States United States |
30% |
 Netherlands Netherlands |
30% |
 Switzerland Switzerland |
27% |
 Czechia Czechia |
24% |
 Australia Australia |
22% |
 Luxembourg Luxembourg |
20% |
 Ireland Ireland |
18% |
 Slovenia Slovenia |
18% |
 Greece Greece |
17% |
 Spain Spain |
17% |
 Austria Austria |
16% |
 Estonia Estonia |
15% |
 Hungary Hungary |
14% |
 Japan Japan |
12% |
 Norway Norway |
10% |
 Germany Germany |
7% |
 Lithuania Lithuania |
6% |
 Denmark Denmark |
6% |
 United Kingdom United Kingdom |
5% |
 Slovak Republic Slovak Republic |
5% |
 Latvia Latvia |
5% |
 Poland Poland |
2% |
 Croatia Croatia |
-1% |
 Sweden Sweden |
-2% |
 Belgium Belgium |
-4% |
 France France |
-6% |
 Bulgaria Bulgaria |
-12% |
 Italy Italy |
-13% |
 Korea Korea |
-17% |
 Finland Finland |
-19% |
 Romania Romania |
-44% |
Ratio indexed to 2015. Bulgaria, Croatia, and Romania are not OECD economies. Data is seasonally adjusted. Data as of Q3 2024. For Canada and Switzerland, data as of Q4 2024.
With the sharpest rise across OECD countries, thousands of Portugese citizens protested about affordability in 2024 amid a shortage of housing supply and an influx of wealthy foreigners moving to the country.
In 2022, roughly half of Portugal’s citizens earned €1,000 a month, making it among the poorest countries in Western Europe. Between 2020 and 2021, home prices shot up 157% alone. In response, the government has proposed a $2.2 billion package to build 33,000 homes by 2030. Still, some residents are skeptical it will materialize.
Ranking in second is Canada, where home prices jumped 65% between 2020 and March 2022. After the Bank of Canada began rate hikes, prices declined 17% from the peak as of late 2024. Like Portugal and several other advanced economies, Canada faces a meaningful shortage of housing.
The U.S. follows next in line, as average home prices hit a record $407,000 in 2024 amid a nearly 20-year low in sales volume. Last year, San Jose and Los Angeles ranked among the world’s most unaffordable housing markets.
Meanwhile, Europe shows wide variations in affordability trends. Countries like Romania, Finland, and Italy have seen their home price-to-income ratio fall in the double-digits since 2015. By contrast, the Netherlands, Switzerland, and Czechia have seen the ratio increase by more than 20%.
Learn More on the Voronoi App 
To learn more about this topic from a U.S.-based perspective, check out this graphic on the home price-to-income ratio across major U.S. cities.
The post Mapped: Home Affordability in OECD Countries Since 2015 appeared first on Visual Capitalist.