Corruption Perceptions Index 2024
This was originally posted on our Voronoi app. Download the app for free on iOS or Android and discover incredible data-driven charts from a variety of trusted sources.
Across the globe, striking disparities exist in government corruption levels, from transparent nations with strong institutional safeguards to countries where endemic official misconduct undermines public trust, economic progress, and even enables serious human rights abuses.
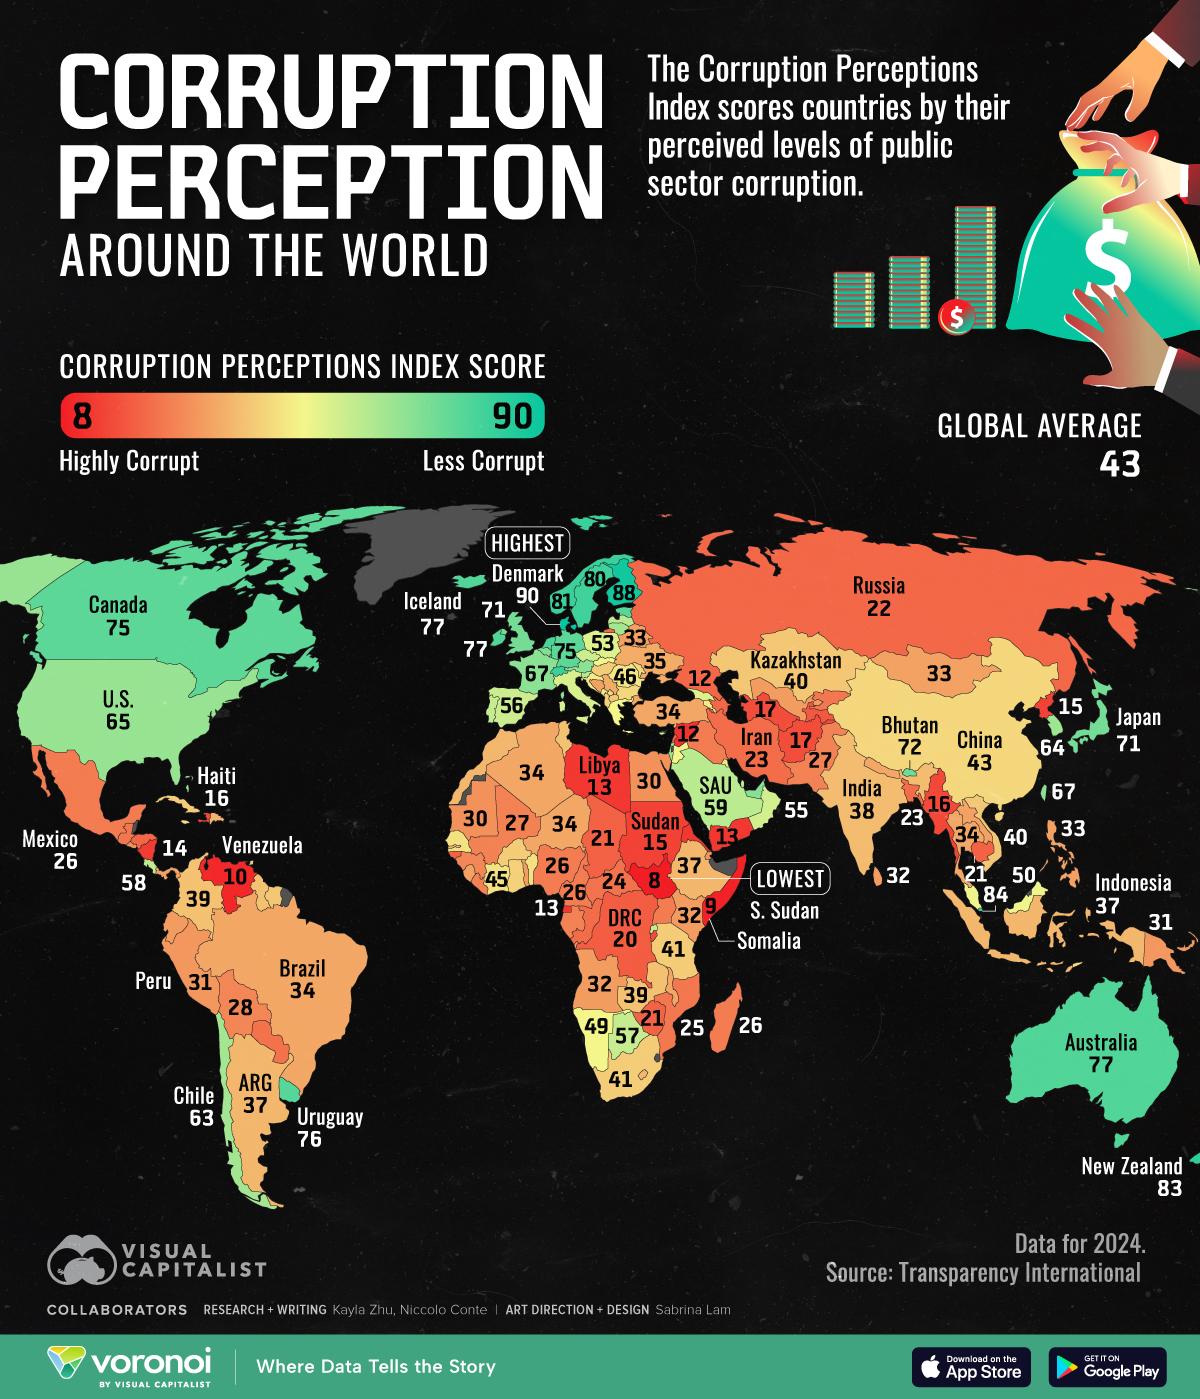
This map visualizes the Corruption Perceptions Index (CPI) of 180 countries and territories.
The CPI ranks countries and territories worldwide by their perceived levels of public sector corruption.
The data is for 2024 and comes from Transparency International.
Corruption Perceptions Around the World
Below, we show the 2024 CPI scores of 180 countries and territories.
Note that a higher score means less perceived corruption.
| Country/Territory | Corruption Perception Index 2024 score |
|---|---|
 Denmark Denmark |
90 |
 Finland Finland |
88 |
 Singapore Singapore |
84 |
 New Zealand New Zealand |
83 |
 Luxembourg Luxembourg |
81 |
 Norway Norway |
81 |
 Switzerland Switzerland |
81 |
 Sweden Sweden |
80 |
 Netherlands Netherlands |
78 |
 Australia Australia |
77 |
 Iceland Iceland |
77 |
 Ireland Ireland |
77 |
 Estonia Estonia |
76 |
 Uruguay Uruguay |
76 |
 Canada Canada |
75 |
 Germany Germany |
75 |
 Hong Kong Hong Kong |
74 |
 Bhutan Bhutan |
72 |
 Seychelles Seychelles |
72 |
 Japan Japan |
71 |
 United Kingdom United Kingdom |
71 |
 Belgium Belgium |
69 |
 Barbados Barbados |
68 |
 United Arab Emirates United Arab Emirates |
68 |
 Austria Austria |
67 |
 France France |
67 |
 Taiwan Taiwan |
67 |
 Bahamas Bahamas |
65 |
 United States United States |
65 |
 Israel Israel |
64 |
 South Korea South Korea |
64 |
 Chile Chile |
63 |
 Lithuania Lithuania |
63 |
 Saint Vincent and the Grenadines Saint Vincent and the Grenadines |
63 |
 Cabo Verde Cabo Verde |
62 |
 Dominica Dominica |
60 |
 Slovenia Slovenia |
60 |
 Latvia Latvia |
59 |
 Qatar Qatar |
59 |
 Saint Lucia Saint Lucia |
59 |
 Saudi Arabia Saudi Arabia |
59 |
 Costa Rica Costa Rica |
58 |
 Botswana Botswana |
57 |
 Portugal Portugal |
57 |
 Rwanda Rwanda |
57 |
 Cyprus Cyprus |
56 |
 Czechia Czechia |
56 |
 Grenada Grenada |
56 |
 Spain Spain |
56 |
 Fiji Fiji |
55 |
 Oman Oman |
55 |
 Italy Italy |
54 |
 Bahrain Bahrain |
53 |
 Georgia Georgia |
53 |
 Poland Poland |
53 |
 Mauritius Mauritius |
51 |
 Malaysia Malaysia |
50 |
 Vanuatu Vanuatu |
50 |
 Greece Greece |
49 |
 Jordan Jordan |
49 |
 Namibia Namibia |
49 |
 Slovakia Slovakia |
49 |
 Armenia Armenia |
47 |
 Croatia Croatia |
47 |
 Kuwait Kuwait |
46 |
 Malta Malta |
46 |
 Montenegro Montenegro |
46 |
 Romania Romania |
46 |
 Benin Benin |
45 |
 Côte d’Ivoire Côte d’Ivoire |
45 |
 São Tomé and Príncipe São Tomé and Príncipe |
45 |
 Senegal Senegal |
45 |
 Jamaica Jamaica |
44 |
 Kosovo Kosovo |
44 |
 Timor-Leste Timor-Leste |
44 |
 Bulgaria Bulgaria |
43 |
 China China |
43 |
 Moldova Moldova |
43 |
 Solomon Islands Solomon Islands |
43 |
 Albania Albania |
42 |
 Ghana Ghana |
42 |
 Burkina Faso Burkina Faso |
41 |
 Cuba Cuba |
41 |
 Hungary Hungary |
41 |
 South Africa South Africa |
41 |
 Tanzania Tanzania |
41 |
 Trinidad and Tobago Trinidad and Tobago |
41 |
 Kazakhstan Kazakhstan |
40 |
 North Macedonia North Macedonia |
40 |
 Suriname Suriname |
40 |
 Vietnam Vietnam |
40 |
 Colombia Colombia |
39 |
 Guyana Guyana |
39 |
 Tunisia Tunisia |
39 |
 Zambia Zambia |
39 |
 Gambia Gambia |
38 |
 India India |
38 |
 Maldives Maldives |
38 |
 Argentina Argentina |
37 |
 Ethiopia Ethiopia |
37 |
 Indonesia Indonesia |
37 |
 Lesotho Lesotho |
37 |
 Morocco Morocco |
37 |
 Dominican Republic Dominican Republic |
36 |
 Serbia Serbia |
35 |
 Ukraine Ukraine |
35 |
 Algeria Algeria |
34 |
 Brazil Brazil |
34 |
 Malawi Malawi |
34 |
 Nepal Nepal |
34 |
 Niger Niger |
34 |
 Thailand Thailand |
34 |
 Turkey Turkey |
34 |
 Belarus Belarus |
33 |
 Bosnia and Herzegovina Bosnia and Herzegovina |
33 |
 Laos Laos |
33 |
 Mongolia Mongolia |
33 |
 Panama Panama |
33 |
 Philippines Philippines |
33 |
 Sierra Leone Sierra Leone |
33 |
 Angola Angola |
32 |
 Ecuador Ecuador |
32 |
 Kenya Kenya |
32 |
 Sri Lanka Sri Lanka |
32 |
 Togo Togo |
32 |
 Uzbekistan Uzbekistan |
32 |
 Djibouti Djibouti |
31 |
 Papua New Guinea Papua New Guinea |
31 |
 Peru Peru |
31 |
 Egypt Egypt |
30 |
 El Salvador El Salvador |
30 |
 Mauritania Mauritania |
30 |
 Bolivia Bolivia |
28 |
 Guinea Guinea |
28 |
 Eswatini Eswatini |
27 |
 Gabon Gabon |
27 |
 Liberia Liberia |
27 |
 Mali Mali |
27 |
 Pakistan Pakistan |
27 |
 Cameroon Cameroon |
26 |
 Iraq Iraq |
26 |
 Madagascar Madagascar |
26 |
 Mexico Mexico |
26 |
 Nigeria Nigeria |
26 |
 Uganda Uganda |
26 |
 Guatemala Guatemala |
25 |
 Kyrgyzstan Kyrgyzstan |
25 |
 Mozambique Mozambique |
25 |
 Central African Republic Central African Republic |
24 |
 Paraguay Paraguay |
24 |
 Bangladesh Bangladesh |
23 |
 Congo Congo |
23 |
 Iran Iran |
23 |
 Azerbaijan Azerbaijan |
22 |
 Honduras Honduras |
22 |
 Lebanon Lebanon |
22 |
 Russia Russia |
22 |
 Cambodia Cambodia |
21 |
 Chad Chad |
21 |
 Comoros Comoros |
21 |
 Guinea-Bissau Guinea-Bissau |
21 |
 Zimbabwe Zimbabwe |
21 |
 Democratic Republic of the Congo Democratic Republic of the Congo |
20 |
 Tajikistan Tajikistan |
19 |
 Afghanistan Afghanistan |
17 |
 Burundi Burundi |
17 |
 Turkmenistan Turkmenistan |
17 |
 Haiti Haiti |
16 |
 Myanmar Myanmar |
16 |
 North Korea North Korea |
15 |
 Sudan Sudan |
15 |
 Nicaragua Nicaragua |
14 |
 Equatorial Guinea Equatorial Guinea |
13 |
 Eritrea Eritrea |
13 |
 Libya Libya |
13 |
 Yemen Yemen |
13 |
 Syria Syria |
12 |
 Venezuela Venezuela |
10 |
 Somalia Somalia |
9 |
 South Sudan South Sudan |
8 |
Nordic countries lead in perceived transparency, with Denmark securing the top spot in the 2024 Corruption Perception Index—its seventh consecutive year—followed closely by Finland.
Nordic countries typically record lower perceived corruption due to strong institutions that promote transparency and accountability, extensive welfare benefits, and well-functioning democracies. These countries also consistently rank among the happiest countries in the world.
The United States and Canada landed at 65 and 75, respectively, reflecting moderate corruption concerns compared to top-ranking peers. Both saw slight dips to their CPI scores from 2023, with the U.S. dropping by 4 points and Canada by 1.
Meanwhile, Sub-Saharan Africa had the lowest regional scores, with an average of 33. South Sudan ranked as the most corrupt country in 2024, with a score of 8.
A recent UN Commission report found that South Sudan’s political leaders are fueling violence, obstructing peace, and perpetuating gross human rights violations through impunity and corruption. The report highlights pervasive issues such as systematic sexual violence, forced child recruitment, and numerous incidents of human rights abuses perpetrated by government and military officials.
Corruption remains a persistent issue in fragile states, where weak enforcement and political instability allow it to thrive.
Measuring Corruption
CPI scores are calculated through a combination of at least three data sources drawn from 13 different corruption surveys and assessments, answered by experts and business executives.
The data sources used to compile the CPI covers corruption types such as:
- Bribery
- Diversion of public funds
- Officials using their public office for private gain without facing consequences
- Nepotistic appointments in the civil service
- Legal protection for people who report cases of bribery and corruption
- And more
Learn More on the Voronoi App 
To learn more about government trust around the world, check out this graphic that visualizes the Edelman Trust Index in 2024, which scores countries based on their average percent trust in NGOs, business, and government.
The post Mapped: Which Countries Are Perceived as the Most Corrupt? appeared first on Visual Capitalist.