Visualizing R&D Investment by Country
This was originally posted on our Voronoi app. Download the app for free on iOS or Android and discover incredible data-driven charts from a variety of trusted sources.
Key Takeaways
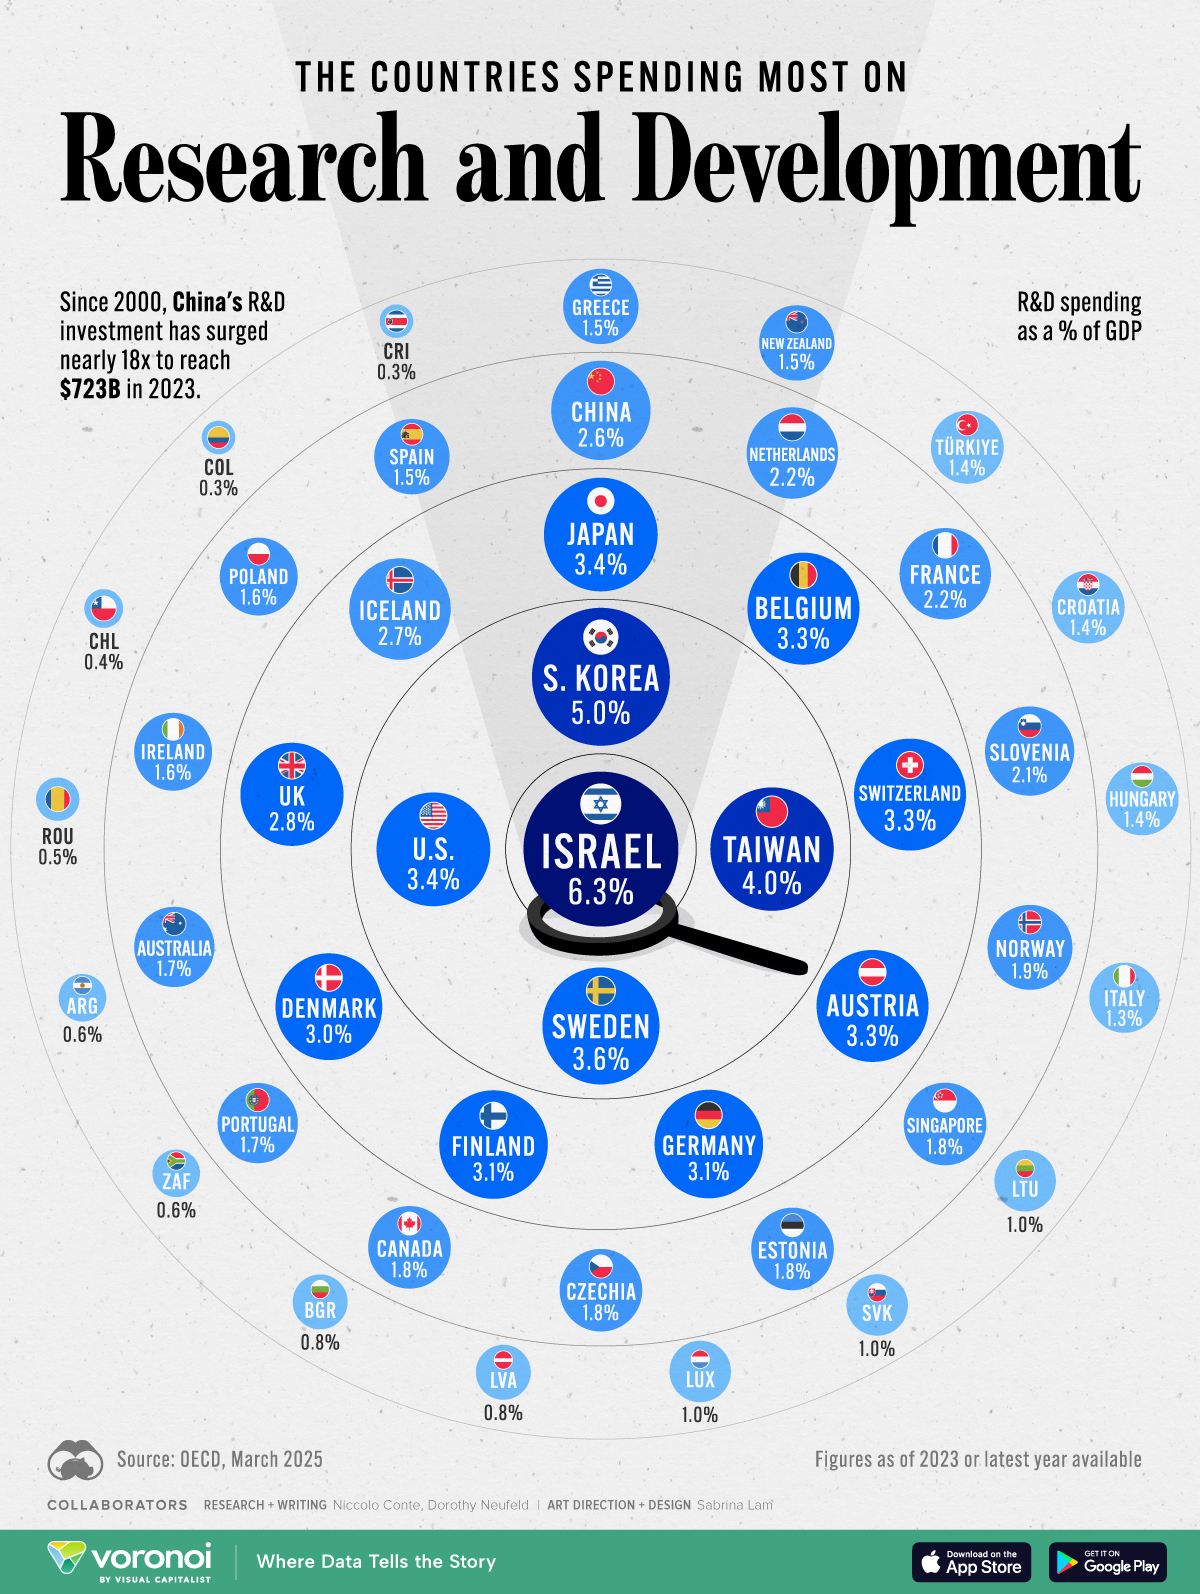
- Israel spent $28.3 billion on research and development (R&D) in 2023 to reach 6.3% of GDP—more than double the OECD average.
- South Korea falls next in line, with an R&D intensity of 5% of GDP, driven mainly from private sector funding.
- Meanwhile, the U.S. spent 3.4% of GDP on R&D, amounting to $823.4 billion, the highest level in the world.
Globally, research and development (R&D) spending totaled $2.8 trillion in 2023—growing from $1 trillion, adjusted for inflation, since the turn of the century.
Overall, Asian economies accounted for 46% of this spending, followed by North America (29%) and Europe (21%). As a critical driver of innovation, R&D investment shapes countless industries, from defense and healthcare to tech and green energy.
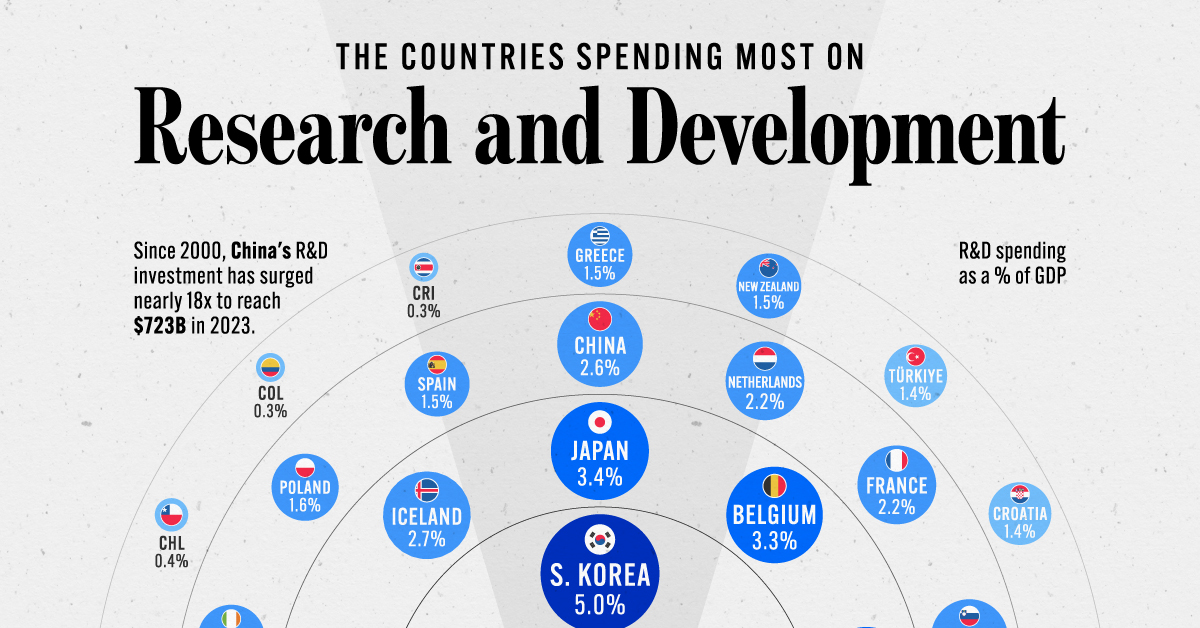
This graphic shows R&D investment as a percentage of GDP by country, based on data from the OECD.
Ranked: The R&D Intensity of OECD Countries
Below, we show OECD countries by R&D spending as a share of GDP in 2023, based on the most recent data available:
| Country | R&D Spending as a % of GDP 2023 |
|---|---|
 Israel Israel |
6.3 |
 South Korea South Korea |
5.0 |
 Taiwan Taiwan |
4.0 |
 Sweden Sweden |
3.6 |
 United States United States |
3.4 |
 Japan Japan |
3.4 |
 Belgium Belgium |
3.3 |
 Switzerland Switzerland |
3.3 |
 Austria Austria |
3.3 |
 Germany Germany |
3.1 |
 Finland Finland |
3.1 |
 Denmark Denmark |
3.0 |
 United Kingdom United Kingdom |
2.8 |
 Iceland Iceland |
2.7 |
 China China |
2.6 |
 Netherlands Netherlands |
2.2 |
 France France |
2.2 |
 Slovenia Slovenia |
2.1 |
 Norway Norway |
1.9 |
 Singapore Singapore |
1.8 |
 Estonia Estonia |
1.8 |
 Czechia Czechia |
1.8 |
 Canada Canada |
1.8 |
 Portugal Portugal |
1.7 |
 Australia Australia |
1.7 |
 Ireland Ireland |
1.6 |
 Poland Poland |
1.6 |
 Spain Spain |
1.5 |
 Greece Greece |
1.5 |
 New Zealand New Zealand |
1.5 |
 Türkiye Türkiye |
1.4 |
 Croatia Croatia |
1.4 |
 Hungary Hungary |
1.4 |
 Italy Italy |
1.3 |
 Lithuania Lithuania |
1.0 |
 Slovak Republic Slovak Republic |
1.0 |
 Luxembourg Luxembourg |
1.0 |
 Latvia Latvia |
0.8 |
 Bulgaria Bulgaria |
0.8 |
 South Africa South Africa |
0.6 |
 Argentina Argentina |
0.6 |
 Romania Romania |
0.5 |
 Chile Chile |
0.4 |
 Colombia Colombia |
0.3 |
 Costa Rica Costa Rica |
0.3 |
Since 2020, OECD countries have spent an average of 2.7% of their GDP on R&D, altogether spending $1.9 trillion in 2023.
Israel stands out globally—not only for leading in R&D intensity, but also for having the highest number of high-tech startups per capita. Overall, it spent $28.3 billion on R&D, with about 92% driven by the private sector.
Also seeing among the highest R&D to GDP are South Korea, Taiwan, and Sweden.
In Taiwan, corporate R&D investment rose by 3.7% in 2023, a slowdown compared to the 8.8% annual average over the previous five years—largely fueled by the semiconductor sector. The small island nation spent $59.9 billion on R&D in 2023, the eighth-highest in the OECD.
When it comes to China, R&D investment has surged nearly eighteenfold since 2000, to reach $723 billion—the second-highest globally. To look at it another way, China’s share of global R&D spending grew from 4% to 26% over the period. Overall, the private sector contributed 77.6% of this spending in 2023, a similar level seen in America.
Learn More on the Voronoi App 
To learn more about this topic from a tech sector perspective, check out this graphic on R&D investment growth across global tech giants.