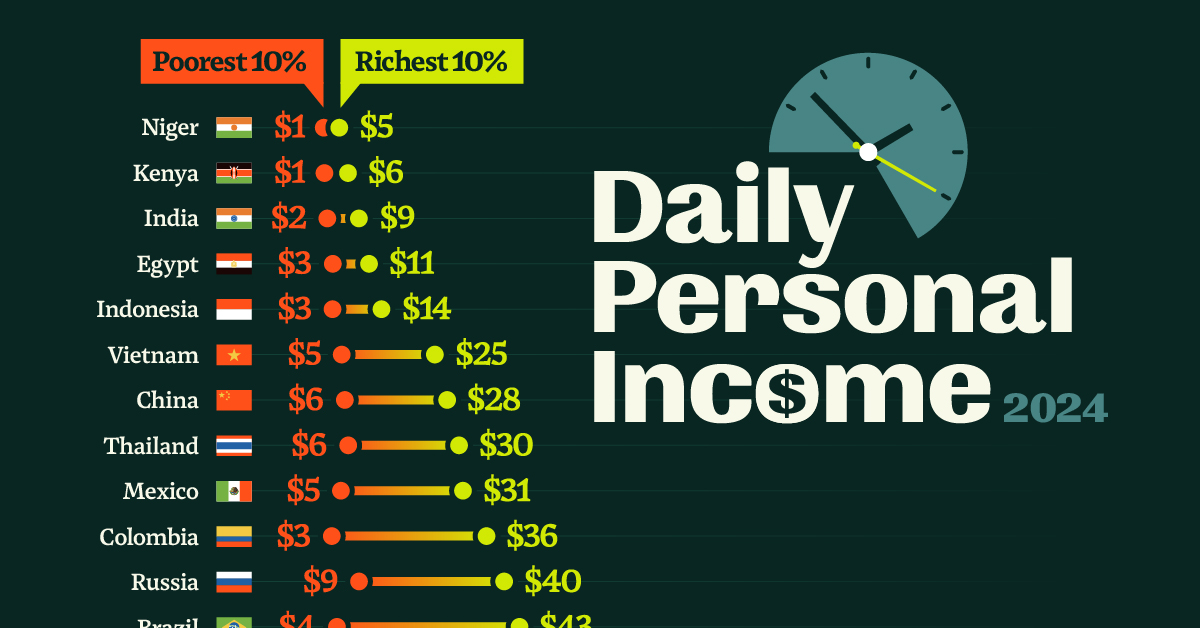
Ranked: Daily Incomes of the Richest and Poorest in 25 Countries
This was originally posted on our Voronoi app. Download the app for free on iOS or Android and discover incredible data-driven charts from a variety of trusted sources.
Key Takeaways
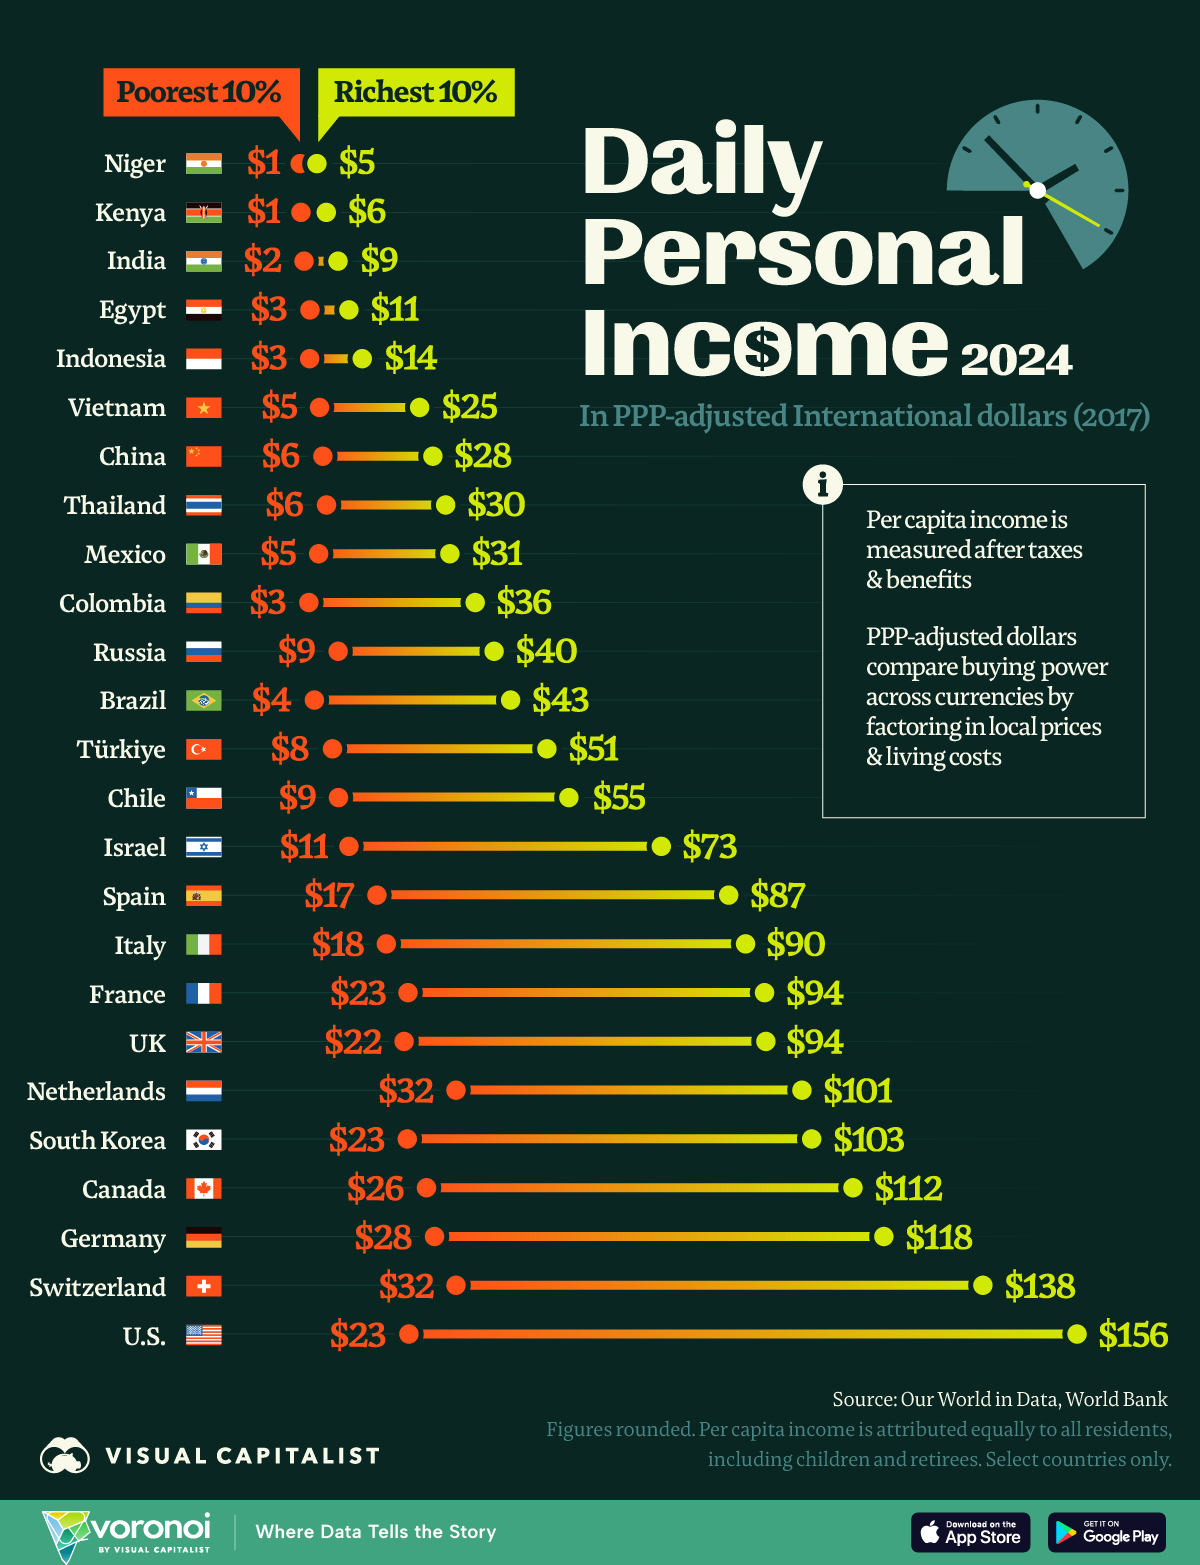
- The richest 10% of Americans on average earn more daily ($156 per person) than similar groups worldwide.
- They also make nearly 7x than the bottom 10% of Americans.
- Yet, the bottom 10% in the U.S. earn more than the top 10% in many countries, including Indonesia, Egypt, and India.
There are many ways to compare countries economically, but each has shortcomings—GDP ignores population, while GDP per capita overlooks income distribution.
For a closer look at living standards, we visualize 2024 income (or consumption) figures from Our World in Data. All figures are in international dollars at 2017 prices adjusted for purchasing power parity (PPP).
Because it’s per capita, income is averaged across all people—including children and retirees. In practice, working adults are possibly earning about twice the listed amount to support their households.
Average Daily Incomes Compared by Country
The richest 10% of Americans on average earn more daily ($156 per person) than similar groups worldwide. They also make nearly 7x than the bottom 10% of Americans.
This table includes the full dataset of 108 countries.
| Country | Richest 10% (International dollars) |
Poorest 10% (International dollars) |
|---|---|---|
 Luxembourg Luxembourg |
$165.97 | $37.03 |
 United States United States |
$156.42 | $22.93 |
 Switzerland Switzerland |
$137.61 | $32.32 |
 Norway Norway |
$117.91 | $34.47 |
 Germany Germany |
$117.82 | $28.05 |
 Canada Canada |
$111.65 | $26.40 |
 Austria Austria |
$109.55 | $27.69 |
 South Korea South Korea |
$103.40 | $22.60 |
 Denmark Denmark |
$103.05 | $31.86 |
 Netherlands Netherlands |
$101.45 | $32.34 |
 Sweden Sweden |
$98.05 | $24.72 |
 Ireland Ireland |
$97.56 | $27.77 |
 Malta Malta |
$96.06 | $24.14 |
 Belgium Belgium |
$95.44 | $29.26 |
 Finland Finland |
$95.22 | $28.91 |
 United Kingdom United Kingdom |
$94.25 | $21.97 |
 France France |
$93.98 | $22.75 |
 Cyprus Cyprus |
$90.63 | $24.30 |
 Italy Italy |
$90.19 | $18.42 |
 Estonia Estonia |
$89.00 | $21.15 |
 Spain Spain |
$86.82 | $16.54 |
 Taiwan Taiwan |
$85.25 | $22.28 |
 Lithuania Lithuania |
$80.01 | $16.81 |
 Slovenia Slovenia |
$74.99 | $25.56 |
 Israel Israel |
$73.36 | $11.22 |
 Czechia Czechia |
$67.20 | $21.69 |
 Malaysia Malaysia |
$65.80 | $10.55 |
 Portugal Portugal |
$65.39 | $14.43 |
 Latvia Latvia |
$64.87 | $14.14 |
 Poland Poland |
$63.37 | $17.79 |
 Panama Panama |
$61.67 | $5.67 |
 Bulgaria Bulgaria |
$56.92 | $10.03 |
 Chile Chile |
$54.89 | $8.86 |
 Costa Rica Costa Rica |
$54.83 | $6.08 |
 Uruguay Uruguay |
$53.95 | $8.09 |
 Greece Greece |
$53.79 | $11.67 |
 Croatia Croatia |
$53.62 | $13.94 |
 Turkey Turkey |
$50.50 | $7.66 |
 Hungary Hungary |
$47.45 | $15.69 |
 Romania Romania |
$46.78 | $8.94 |
 Brazil Brazil |
$43.25 | $4.05 |
 Russia Russia |
$39.95 | $8.79 |
 Jamaica Jamaica |
$39.26 | $5.92 |
 Bolivia Bolivia |
$38.34 | $5.52 |
 Slovakia Slovakia |
$38.34 | $12.00 |
 Colombia Colombia |
$36.17 | $2.94 |
 Paraguay Paraguay |
$34.99 | $4.89 |
 Montenegro Montenegro |
$33.79 | $6.28 |
 Serbia Serbia |
$32.42 | $7.83 |
 Maldives Maldives |
$32.39 | $8.48 |
 Mexico Mexico |
$31.11 | $4.90 |
 Suriname Suriname |
$30.64 | $5.21 |
 Thailand Thailand |
$30.27 | $6.47 |
 Ecuador Ecuador |
$30.08 | $3.57 |
 Belarus Belarus |
$29.77 | $10.23 |
 China China |
$27.72 | $5.74 |
 North Macedonia North Macedonia |
$26.93 | $4.60 |
 Bhutan Bhutan |
$26.22 | $7.21 |
 Dominican Republic Dominican Republic |
$26.05 | $4.99 |
 Vietnam Vietnam |
$25.07 | $5.07 |
 El Salvador El Salvador |
$24.75 | $3.93 |
 Tunisia Tunisia |
$24.71 | $5.80 |
 Iran Iran |
$24.13 | $5.03 |
 Albania Albania |
$24.12 | $6.13 |
 Uzbekistan Uzbekistan |
$24.09 | $5.22 |
 Peru Peru |
$23.31 | $3.73 |
 Ukraine Ukraine |
$22.90 | $7.42 |
 Kazakhstan Kazakhstan |
$22.37 | $6.78 |
 Marshall Islands Marshall Islands |
$21.75 | $4.36 |
 Honduras Honduras |
$21.34 | $1.91 |
 Mongolia Mongolia |
$21.31 | $5.19 |
 Moldova Moldova |
$18.95 | $6.26 |
 Tonga Tonga |
$18.65 | $5.54 |
 Sri Lanka Sri Lanka |
$16.43 | $3.51 |
 Nepal Nepal |
$15.06 | $3.97 |
 Georgia Georgia |
$14.73 | $3.12 |
 Fiji Fiji |
$13.88 | $3.37 |
 Indonesia Indonesia |
$13.61 | $3.10 |
 Armenia Armenia |
$12.35 | $3.65 |
 Philippines Philippines |
$12.04 | $2.41 |
 Kyrgyzstan Kyrgyzstan |
$11.18 | $3.55 |
 Mauritania Mauritania |
$11.02 | $2.60 |
 Egypt Egypt |
$10.94 | $3.16 |
 Cameroon Cameroon |
$10.73 | $1.49 |
 Senegal Senegal |
$10.41 | $2.15 |
 Bangladesh Bangladesh |
$10.26 | $2.53 |
 Kiribati Kiribati |
$10.15 | $3.05 |
 Côte d’Ivoire Côte d’Ivoire |
$10.04 | $2.16 |
 Vanuatu Vanuatu |
$9.36 | $2.15 |
 Gambia Gambia |
$9.24 | $1.74 |
 Zimbabwe Zimbabwe |
$9.02 | $1.10 |
 Benin Benin |
$8.92 | $1.97 |
 India India |
$8.76 | $1.98 |
 Mali Mali |
$8.11 | $1.71 |
 Togo Togo |
$7.82 | $1.46 |
 Burkina Faso Burkina Faso |
$7.52 | $1.55 |
 Chad Chad |
$7.21 | $1.40 |
 Guinea-Bissau Guinea-Bissau |
$7.07 | $1.59 |
 Uganda Uganda |
$6.44 | $1.12 |
 Kenya Kenya |
$6.42 | $1.36 |
 Syria Syria |
$5.53 | $1.58 |
 Zambia Zambia |
$5.52 | $0.50 |
 Niger Niger |
$4.55 | $1.21 |
 Central African Republic Central African Republic |
$4.39 | $0.65 |
 Burundi Burundi |
$4.22 | $0.85 |
 Mozambique Mozambique |
$3.96 | $0.50 |
 Malawi Malawi |
$3.81 | $0.74 |
 Democratic Republic of Congo Democratic Republic of Congo |
$3.31 | $0.49 |
Note: Figures are rounded in the visualization but left unedited in this table.
Yet, the bottom 10% in the U.S. earn more than the top 10% in many countries, including Indonesia, Egypt, and India.
Luxembourg’s richest 10% (not visualized, but in the data set) out-earn Americans, the only country to do so.
The Tricky Part of Comparing Income Inequality Globally
This chart looks at the average daily per capita income of wealth groups in countries with starkly different populations.
The top 10% in the U.S., is about 34 million individuals, compared to India and China’s 140 million individuals.
Nevertheless it is a good representation for how incomes and consumption are generally higher in Western, industrialized countries.
Although the data is adjusted for purchasing power parity, the method still has limitations. One key issue is that the standard basket of goods used as a baseline may include items that people in some countries don’t need, buy, or prioritize.
Learn More on the Voronoi App 
For a closer look at America’s wealth distribution, check out: A Visual Breakdown of Who Owns America’s Wealth.
The post Ranked: Daily Incomes of the Richest and Poorest in 25 Countries appeared first on Visual Capitalist.