Ranked: Imported Goods as a Share of GDP in 2024
This was originally posted on our Voronoi app. Download the app for free on iOS or Android and discover incredible data-driven charts from a variety of trusted sources.
Key Takeaways
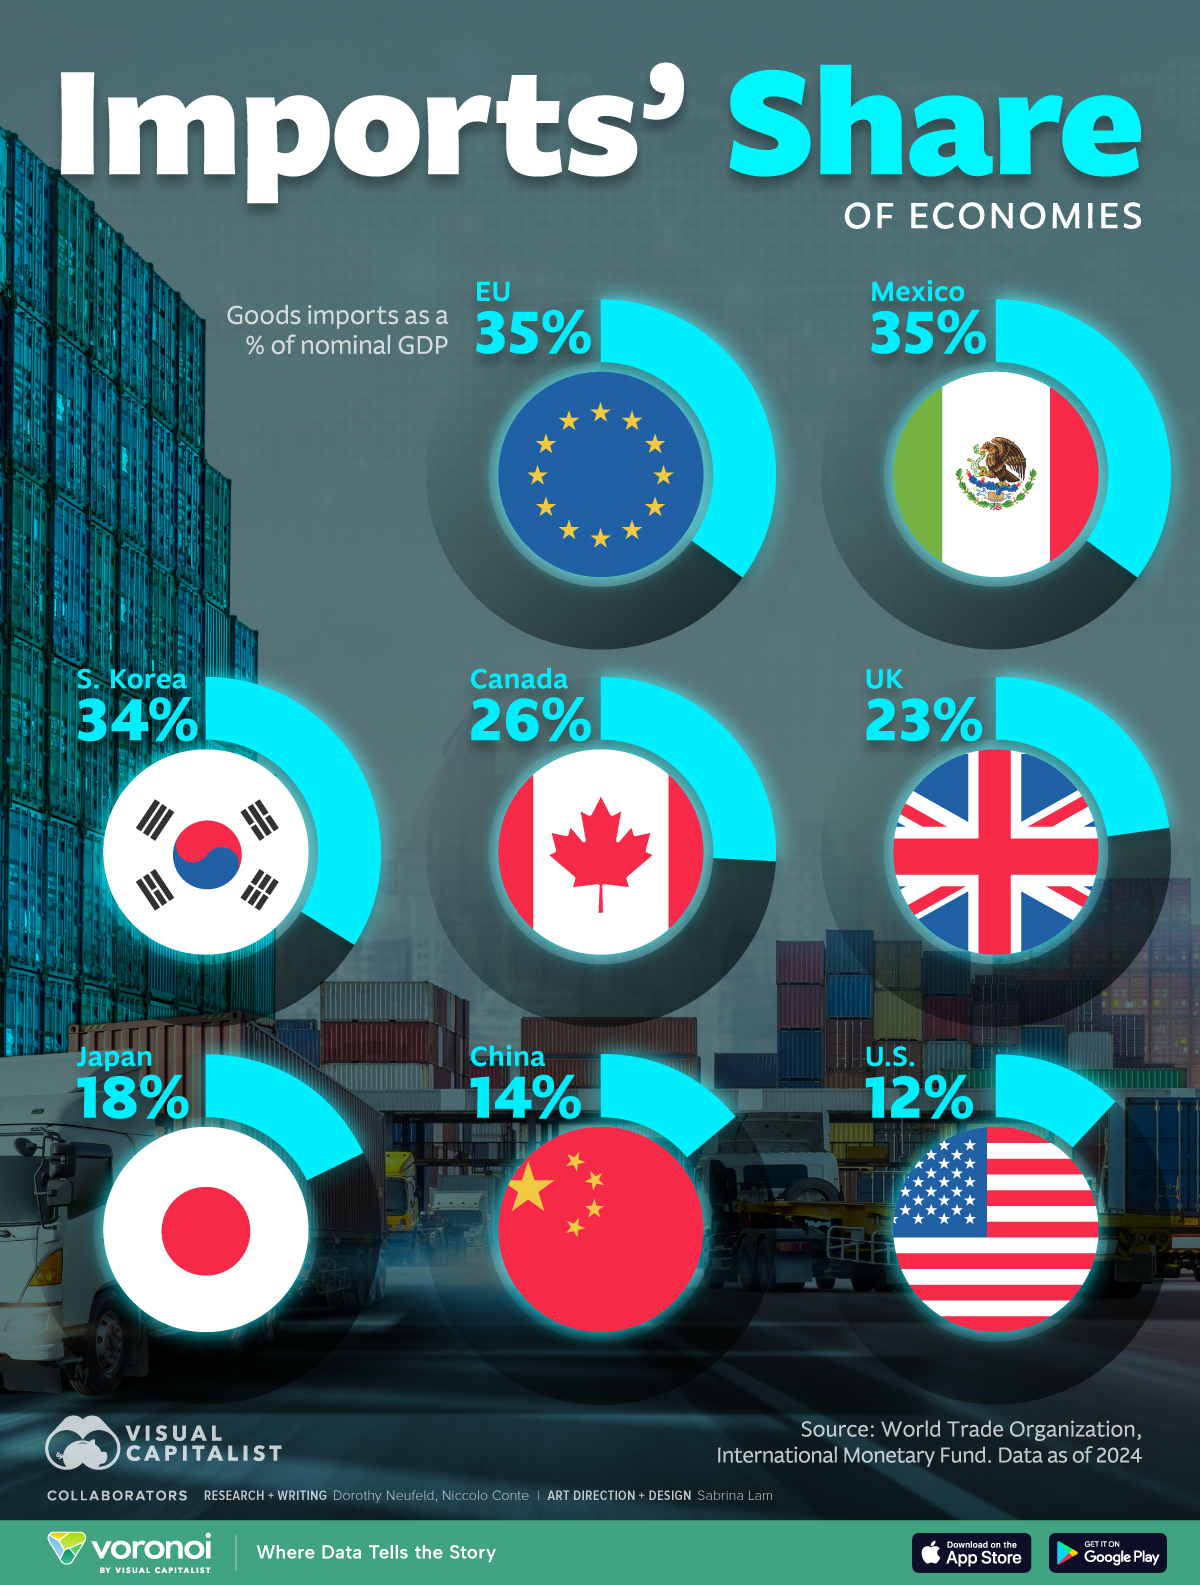
- The U.S. brought in $3.4 trillion worth of goods in 2024—the equivalent of 12% of GDP.
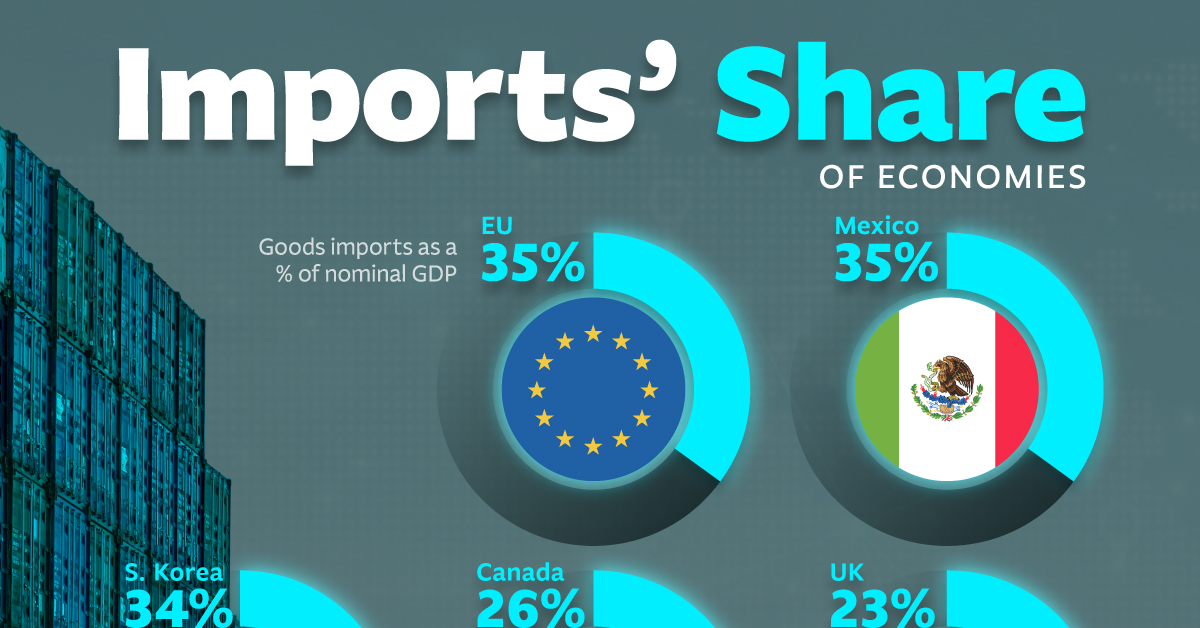
- Imports in the European Union are equal to 35% of GDP, largely driven by fossil fuels and electronics imports.
- China imported $2.6 trillion in 2024, equal to about 14% of GDP
In 2024, $24.7 trillion in goods were imported worldwide, with some countries relying more heavily on imports than others.
Mexico, for instance, has a high import dependency, given its reliance on the U.S. for agricultural goods and auto parts. Meanwhile, imports are equivalent to more than a third of GDP in South Korea, fueled by food and energy imports.
This graphic shows the value of imported goods as a share of GDP in major economies, based on data from multiple sources.
Which Countries Rely the Most on Imported Goods?
Import dependency is driven from many factors, including a lack of natural resources, manufacturing capacity, and cost differentials.
In the European Union, imported goods are equal to 35% of GDP given its reliance on energy imports from Norway and America. Meanwhile, it imports a significant volume of electronics from China, its largest import partner covering 20.1% of the total share.
| Economy | Goods Imports as % of Nominal GDP (2024) |
|---|---|
 European Union European Union |
35% |
 Mexico Mexico |
35% |
 South Korea South Korea |
34% |
 Canada Canada |
26% |
 United Kingdom United Kingdom |
23% |
 Japan Japan |
18% |
 China China |
14% |
 U.S. U.S. |
12% |
Like the European Union, Canada is highly reliant on imports—particularly for motor vehicles and parts, machinery, and electronics.
Notably, the U.S. supplies roughly half of these imports, while China accounts for about 11%. Since the 1960s, trade in the auto sector between the U.S. and Canada has been deeply intertwined, with some parts crossing the border seven times.
China, meanwhile, has a higher import dependency than America when comparing to GDP. Overall, imported goods make up 14% of GDP, with the largest suppliers in 2023 being South Korea (7.4%), the U.S. (7.0%), and Japan (6.3%). Crude petroleum stood as the largest export, largely sourced from Russia and Saudi Arabia.
In comparison, U.S. imported goods are equal to 12% of economic output—significantly lower than several major economies. In 2023, Canada and Mexico together supplied 28.8% of the country’s imports, dominated by crude petroleum and cars.
Learn More on the Voronoi App 
To learn more about this topic from an export perspective, check out this graphic on the export dependency of major economies.