Ranked: Top Countries by Stock Market Returns Since 2015
This was originally posted on our Voronoi app. Download the app for free on iOS or Android and discover incredible data-driven charts from a variety of trusted sources.
Key Takeaways
- The S&P 500 delivered a 17% annualized return in 10 years, the most for major stock exchanges from around the world.
- However major indices from Brazil, India, and Vietnam have also logged between 12–16% returns.
Thinking of becoming a true global investor with investments around the world?
Wondering what financial markets to enter next?
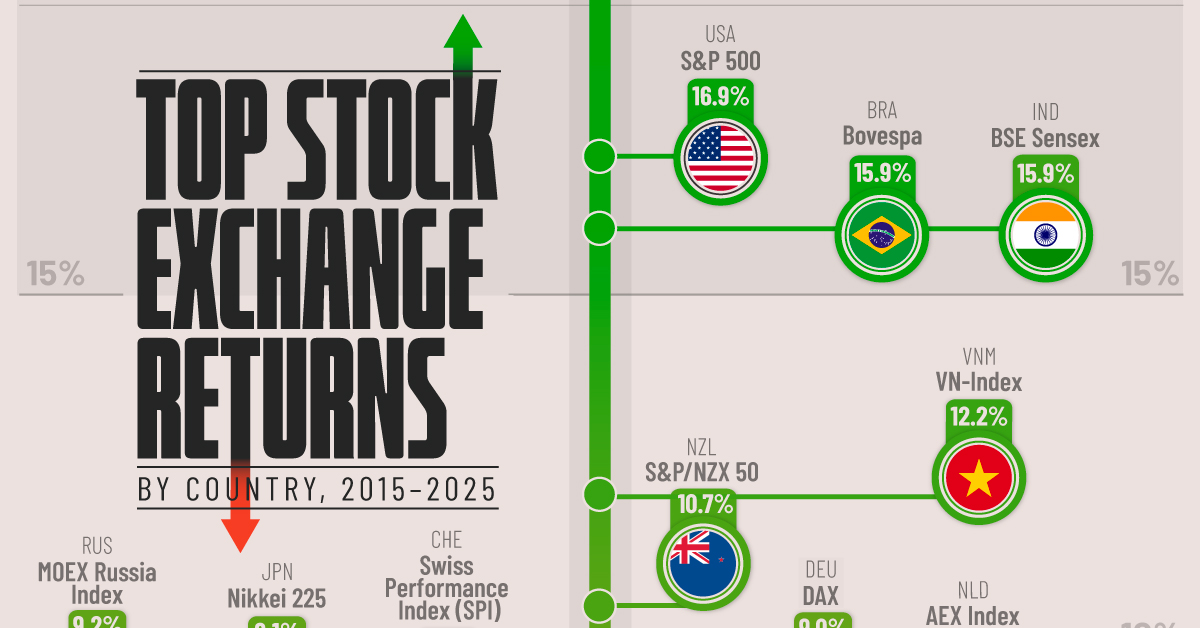
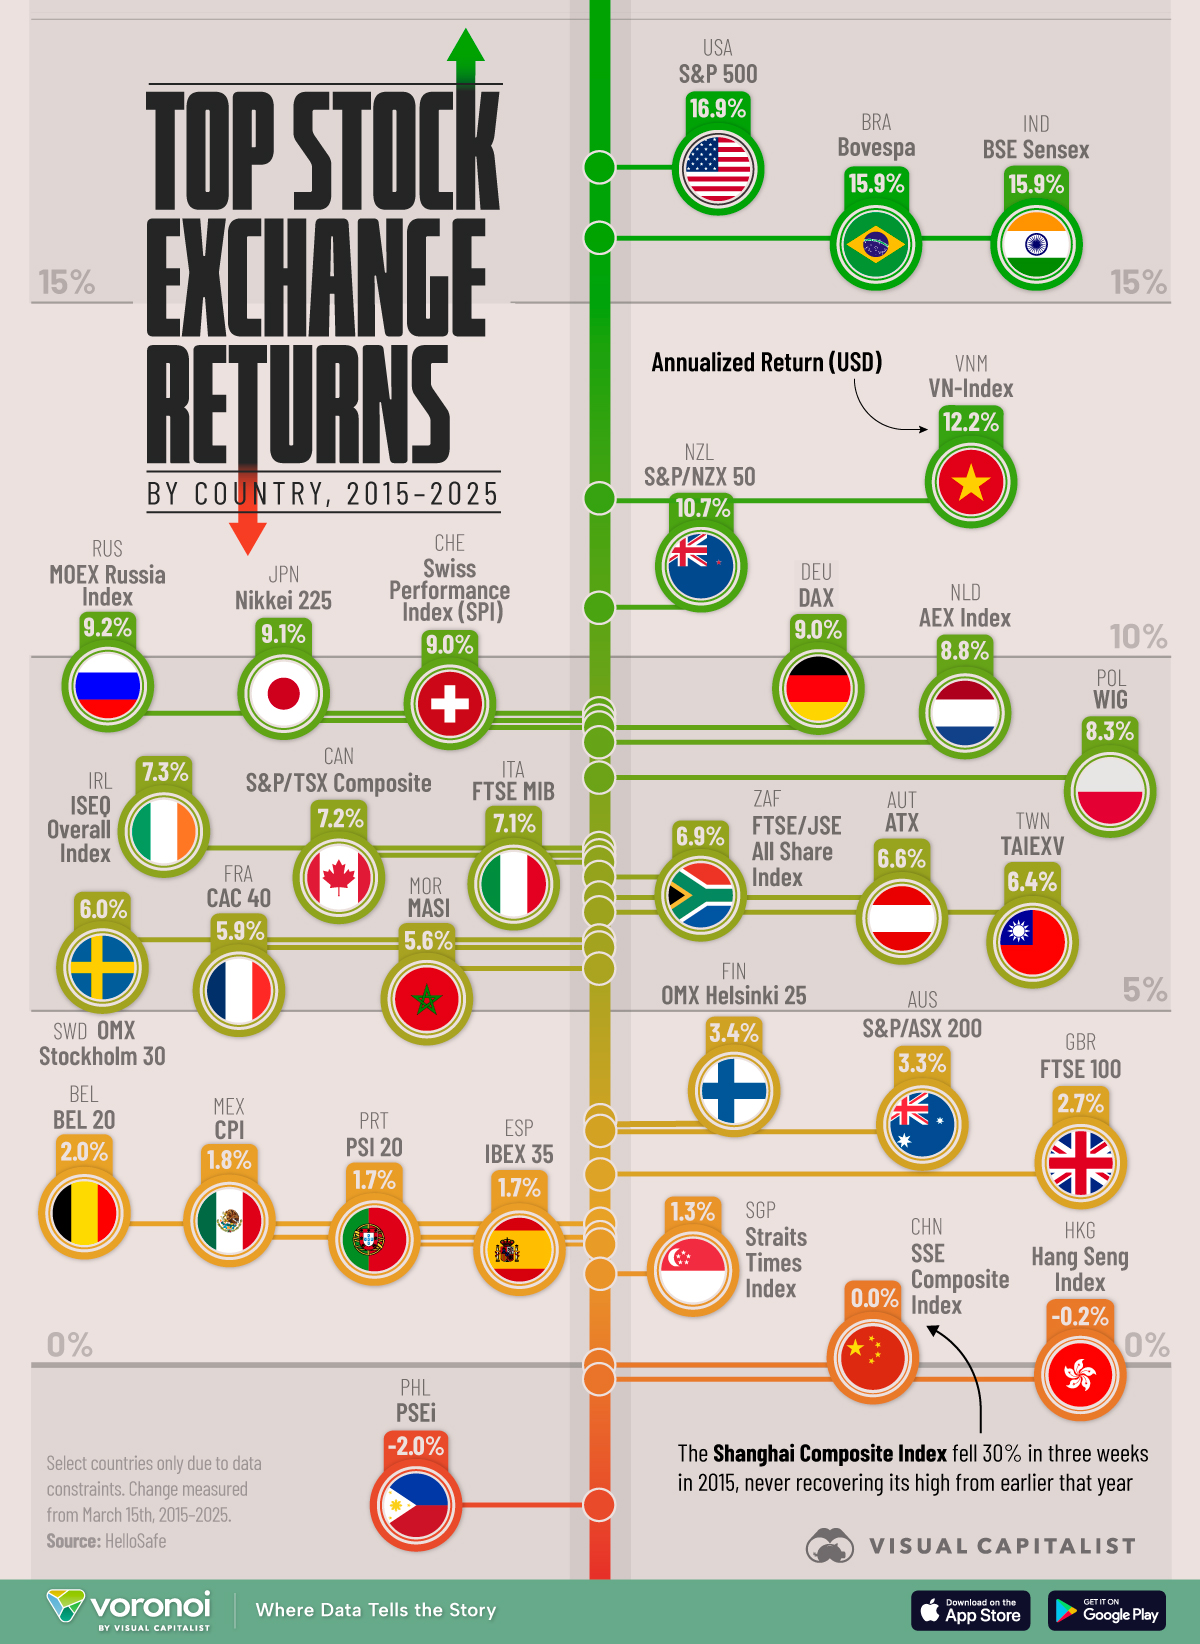
This chart, which visualizes annualized returns (in U.S. dollars) between March 15th, 2015–2025 from major stock exchanges in 30 countries, has some insights.
Data is sourced from HelloSafe, a Canadian insurance comparison platform.
The Best Stock Exchanges For Returns Since 2015
The S&P 500 delivered a 17% annualized return in 10 years, the most for major stock exchanges from around the world.
That’s nearly 5x in returns, which means $10,000 invested in 2015 would be almost $50,000 in 2025.
| Rank | Countries | Main Index | Annualized Return (2015-2025) |
|---|---|---|---|
| 1 |  U.S. U.S. |
S&P 500 | 16.9% |
| 2 |  Brazil Brazil |
Bovespa | 15.9% |
| 3 |  India India |
BSE Sensex | 15.9% |
| 4 |  Vietnam Vietnam |
VN-Index | 12.2% |
| 5 |  New Zealand New Zealand |
S&P/NZX 50 | 10.7% |
| 6 |  Russia Russia |
MOEX Russia Index | 9.2% |
| 7 |  Japan Japan |
Nikkei 225 | 9.1% |
| 8 |  Switzerland Switzerland |
Swiss Performance Index (SPI) | 9.0% |
| 9 |  Germany Germany |
DAX | 9.0% |
| 10 |  Netherlands Netherlands |
AEX Index | 8.8% |
| 11 |  Poland Poland |
WIG | 8.3% |
| 12 |  Ireland Ireland |
ISEQ Overall Index | 7.3% |
| 13 |  Canada Canada |
S&P/TSX Composite | 7.2% |
| 14 |  Italy Italy |
FTSE MIB | 7.1% |
| 15 |  South Africa South Africa |
FTSE/JSE All Share Index |
6.9% |
| 16 |  Austria Austria |
ATX | 6.6% |
| 17 |  Taiwan Taiwan |
TAIEX | 6.4% |
| 18 |  Sweden Sweden |
OMX Stockholm 30 | 6.0% |
| 19 |  France France |
CAC 40 | 5.9% |
| 20 |  Morocco Morocco |
MASI | 5.6% |
| 21 |  Finland Finland |
OMX Helsinki 25 | 3.4% |
| 22 |  Australia Australia |
S&P/ASX 200 | 3.3% |
| 23 |  UK UK |
FTSE 100 | 2.7% |
| 24 |  Belgium Belgium |
BEL 20 | 2.0% |
| 25 |  Mexico Mexico |
CPI | 1.8% |
| 26 |  Portugal Portugal |
PSI 20 | 1.7% |
| 27 |  Spain Spain |
IBEX 35 | 1.7% |
| 28 |  Singapore Singapore |
Straits Times Index | 1.3% |
| 29 |  China China |
SSE Composite Index | 0.0% |
| 30 |  Hong Kong Hong Kong |
Hang Seng Index | -0.2% |
| 31 |  Philippines Philippines |
PSEi | -2.0% |
However, major indices from Brazil, India, and Vietnam have also logged between 12–16%.
They’ve handily beaten exchanges in Europe (the DAX and the FTSE) as well as from other parts of Asia (Nikkei).
But also—why has the SSE Composite Index, which tracks the Shanghai stock exchange, not moved at all?
The 2015 Chinese Bubble Explained
Turns out mass inexperienced investing can have major consequences.
In 2015, China’s stock market experienced a surge in retail investor activity, fueled by speculative reading and easy credit.
As a result, the Shanghai Composite Index, which had been climbing rapidly, peaked in June before crashing 30% over the next three weeks.
As of April, 2025, the Shanghai Composite Index has not yet recovered its 2015 high.
Learn More on the Voronoi App 
What sectors of the economy take up the most room on financial markets worldwide? Check out: Global Stock Market by Sector for a quick overview. Spoiler: your best guess is probably right.